Energy Benchmarking Models for Hotel Buildings: A Case Study in Londrina, Paraná, Brazil
DOI 10.5433/1679-0375.2024.v45.50380
Citation Semin., Ciênc. Exatas Tecnol. 2024, v. 45: e50380
Received: 20 April 2024 Received in revised for: 26 August 2024 Accepted: 29 August 2024 Available online: 20 September 2024
Abstract:
Room occupancy is an important variable influencing electrical energy consumption in hotel buildings. Given the randomness of this variable, energy demands fluctuate, making it challenging to develop accurate models for describing energy use patterns. This research aimed to develop energy benchmarking models for hotels. For this, five hotel buildings in Londrina, Paraná, Brazil, were used as a reference. Data were collected through questionnaires, interviews with hotel managers, site visits, and analysis of project plans. The analyzed indicators included energy use intensity per built-up area (EUI), room night (EUIRN), average room area (EUIRA), and number of rooms (EUIR). Benchmark equations were obtained by multiple linear regression. The response variables were annual energy use, EUI, EUIRA, and EUIR. Benchmarks were classified on a scale from A to E according to operational energy performance, with A being the most efficient and E the least efficient. Of the five buildings, three were categorized into the same class by the three studied models. The classes of the other two buildings varied according to the model, demonstrating the importance of choosing adequate energy performance indicators for each analysis.
Keywords: energy benchmarks, energy efficiency, energy indicators, hotels
Introduction
Maintaining thermal comfort in hotel facilities requires high energy consumption, ultimately increasing carbon dioxide emissions (Katircioglu et al., 2020). In addition to damaging the environment, high energy consumption is associated with high costs and represents a primary cause of financial loss for hotel enterprises (Alzboun et al., 2017). Achieving energy efficiency and relying on renewable energy sources are essential strategies to mitigate these problems.
Studies have shown that the energy demand of hotel enterprises is determined by factors such as geographical location, usage type, hotel classification, occupancy rate, and ranges of services offered (Cunha & Oliveira, 2020). However, there are many challenges in assessing the energy performance of hotel buildings during operation. Most commercial businesses have fixed operating hours, facilitating the identification of energy expenditure patterns. Such a characteristic, however, does not apply to hotels. Room occupancy shows random behavior, leading to fluctuating energy use and hampering the development of accurate predictive models (Yuan et al., 2020).
Predictive models for energy consumption are typically based on historical data on energy use, climate factors (treated as random), physical characteristics of the building (e.g., year of construction, number of floors, type of structure, built-up area), management characteristics, and building uses. The actual energy performance of a reference building is determined by adjusting these parameters to other variables (Chung, 2011). The literature shows that the indicator most used for this purpose is energy use intensity (EUI) (Nguyen & Rockwood, 2019). EUI represents the energy performance of a building during operation and is commonly expressed as a ratio of annual energy consumption to total built-up area (kWh/(m\(^2\cdot\)year)) (Deng & Burnett, 2000).
In a study assessing eight shopping malls in Dubai, Juaidi et al., 2016 used normalized EUI values as an indicator of energy performance. EUI values (kWh/(m\(^2\cdot\)year)) were calculated from energy consumption data collected over 12 consecutive months, year of construction, and the total built-up area of air-conditioned spaces. Similarly, in evaluating the performance of university buildings in China, Ding et al., 2018 expressed energy consumption per unit built-up area. The authors chose this indicator because it was challenging to estimate the number of building users, as some of the rooms were used as research laboratories. For energy assessment in Brazilian schools during operation, Jota et al., 2017 analyzed usable area, number of school days, number of students, school shifts, number of classrooms, and number of classes. The authors observed that climate conditions did not influence energy consumption in public schools, as these institutions do not use cooling or heating systems. Geraldi & Ghisi, 2020 conducted a comprehensive analysis of 5,321 Brazilian school buildings based on energy consumption, floor plan area, and number of students. The authors concluded that the energy performance of this type of building can be reliably determined by expressing EUI as a function of the number of students.
For the assessment of hotel buildings, EUI can be expressed as a function of built-up area (kWh/m\(^2\)) or as a function of the number of guests and rooms (Ding & Liu, 2020). Bohdanowicz & Martinac, 2007 evaluated 184 European hotels and estimated the following energy indicators for luxury and mid-range units, respectively: 364.30 and 285.00 kWh/(m\(^2\cdot\)year), 28.10 and 14.20 MWh/(room\(\cdot\)year), and 89.50 and 47.80 kWh/(guest-night\(\cdot\)year). Wang, 2012 obtained the following energy performance indicators for a sample of 45 hotel buildings in Taiwan: international tourist hotels, 280.10 kWh/(m\(^2\cdot\)year) and 26.70 MWh/(room\(\cdot\)year); standard tourist hotels, 237.70 kWh/(m\(^2\cdot\)year) and 25.00 MWh/(room\(\cdot\)year); hotel enterprises, 186.30 kWh/(m\(^2\cdot\)year) and 14.60 MWh/(room\(\cdot\)year); and bed and breakfast hotels, 143.60 kWh/(m\(^2\cdot\)year) and 9.40 MWh/(room\(\cdot\)year). Lu et al., 2013 analyzed 27 luxury hotels in China and found values of 125.27 kWh/(m\(^2\cdot\)year), 16.74 MWh/(room\(\cdot\)year), and 30.19 kWh/(guest-night\(\cdot\)year). Finally, Ding & Liu, 2020 estimated the average energy performance of 45 four and five-star hotels in Portugal at 151.90 kWh/(m\(^2\cdot\)year) and 24.50 MWh/(room\(\cdot\)year). These findings demonstrate the strong correlation of number of guests and rooms with energy consumption.
The Energy & Environment Agency of Arrábida [ENA], 2020 reported a practical case of energy efficiency benchmarking for hotel buildings in Portugal. As part of the “For a Sustainable Tourism” program, the agency conducted an energy diagnosis of 20 hotels with a star rating of 3 or higher. Other hotel units can consult the best practices of reference buildings to identify opportunities for improvement. ENA expressed performance indicators on a guest\(\cdot\)year or room\(\cdot\)year basis, rather than as a function of built-up area. The mean values of the calculated indicators were 37.8 kWh/(guest\(\cdot\)year) and 64.4 kWh/(room\(\cdot\)year). This example illustrates the successful application of benchmarking for energy management in hotels.
Most studies adopted EUI as an energy performance indicator, likely because of its ease of use and low cost. However, this indicator erroneously suggests that energy consumption is directly proportional to the area of a building. Another disadvantage is that it cannot be adjusted for factors such as heating, ventilation, and air conditioning systems, year of construction, number of floors, and unusual weather conditions (Roth & Rajagopal, 2018). Essentially, the best method for measuring and expressing EUI depends on the type of building under study. In view of the challenging nature of energy research in the hospitality industry and the complexity of determining consumption patterns for hotel buildings, we aimed to conduct a case study of five hotels in Londrina, Paraná, Brazil, and develop energy benchmarking models for hotel buildings.
Methods
To meet the objectives of this study, we first needed to construct a database containing information on energy consumption, building use, occupancy rate, and construction characteristics of the hotel sector. Subsequently, we calculated energy indicators and generated local benchmarking models. Finally, we developed an energy performance classification system to identify the most energy efficient hotels. The research was approved by the Human Research Ethics Committee at the State University of Londrina (CAAE protocol Nº 46152021.6.0000.5231). The following sections describe in detail each research step.
Database creation
The hotels included in the case study are located in Londrina, Paraná, Brazil (23º18’44”S 50º09’46”W, 604 m a.s.l.). According to the Köppen–Geiger world climate classification (Peel et al., 2007), the climate of Londrina is of the Cfa type, described as humid subtropical with hot summers (Barros et al., 2021). Average temperatures range from 19.7 to 29.8 ºC in the hottest month and from 11.7 to 23.6 ºC in the coldest month (Instituto, 2019).
Only medium and large-sized hotel buildings were selected to comprise the sample, as larger enterprises with high quality standards tend to be the largest energy consumers (Bohdanowicz & Martinac, 2007; Boemi et al., 2011; Chedwal et al., 2015; RosselloBatle et al., 2010; Tang et al., 2016; Wang, 2012; Yao et al., 2015). According to the Brazilian Council for Sustainable Construction [CBCS] (), medium and large hotels are defined as independent buildings with multiple floors, more than 40 rooms, and more than 1500 m\(^2\) of built-up area, whose primary function is hospitality. The sampling universe consisted of a list of 28 hotel enterprises provided by the Convention & Visitors Bureau of Londrina.
Information was collected on the number of rooms in each establishment. Urban Property Tax Assessment Statements (Certidão Narrativa de Lançamento de IPTU) available on the Londrina City Hall website (Prefeitura, 2022) were accessed to obtain information on built-up areas. A total of 20 hotels had more than 40 rooms and more than 1500 m\(^2\) of built-up area, being eligible to participate in the study. Hotel managers were contacted and invited to participate in the study. Six managers agreed to participate in the research. Thus, the initial sample comprised six hotel buildings. It should be noted that energy consumption data are considered private in Brazil. Therefore, finding managers to participate in this type of research can be challenging, as they need to be willing to share private information.
Data collection
A literature review showed that the ratio of annual energy consumption to built-up area is the most common EUI indicator used for assessment of energy efficiency in hotel buildings. Occupancy rate also emerged as an important factor for hotel energy assessment. Thus, we chose these variables for investigation of energy performance in the study sample. Hotel managers in Londrina reported that the number of room nights is the main variable used to represent building occupancy. To facilitate data provision by participants, we selected this variable as a representative measure of occupancy.
In accordance with the General Personal Data Protection Law (Lei nº 13.709, ) and given the fact that the studied buildings are privately owned, the electric power company was not authorized to share information on individual monthly energy consumption by consumer units. Therefore, it was necessary to use a questionnaire for data collection. The questionnaire contained the following items:
Name of hotel enterprise.
What was the total number of room nights sold in 2019?
What was the total number of room nights sold in 2020?
What was the total number of room nights sold in 2021?
How do you prefer to provide monthly energy consumption data for the years 2019, 2020, and 2021:
The questionnaire was prepared on Google Forms and sent to the hotel managers by e-mail, together with the informed consent form.
Of the six hotels included in the initial sample, one was excluded from the research for not providing monthly energy consumption data. Thus, the final sample comprised five hotels, coded as H1, H2, H3, H4, and H5. Building plans and aerial images were used to extract the following data: total room area, average room area, number of floors, shape factor, facade materials, solar orientation, type of air conditioning system, year of project approval, building shape, and predominant facade color, as described in Table 1.
| Variable | Unit of Measurement |
|---|---|
| Built-up area | m\(^2\) |
| Number of rooms | - |
| Number of beds | - |
| Monthly energy consumption in 2019 | kWh/month |
| Monthly energy consumption in 2020 | kWh/month |
| Monthly energy consumption in 2021 | kWh/month |
| Number of room nights in 2019 | - |
| Number of room nights in 2020 | - |
| Number of room nights in 2021 | - |
| Total room area | m\(^2\) |
| Average room area | m\(^2\) |
| Number of floors | - |
| Shape factor | - |
| Facade material | - |
| Solar orientation | - |
| Type of air conditioning system | - |
| Year of project approval | - |
| Building shape | - |
| Predominant facade color | - |
Local benchmarking of energy performance
Calculation of EUI indicators
Four EUI indicators were calculated and investigated for their suitability in estimating energy consumption for the reference buildings, as observed in Table 2. These indicators were based on the findings of Wang, 2012; Lu et al., 2013; Ding & Liu, 2020 and ENA (), which demonstrated the potential of different performance indicators in the energy assessment of hotel buildings, and the study by Bohdanowicz & Martinac, 2007, which normalized energy consumption to usable area, number of rooms, and guest-nights.
| Indicator | Description | Unit of Measurement |
|---|---|---|
| EUI | Energy use intensity/built-up area | kWh/m\(^2\) |
| EUI\(_\text{RA}\) | Energy use intensity/average room area | kWh/m\(^2\) |
| EUI\(_\text{RN}\) | Energy use intensity/room night | kWh/room night |
| EUI\(_\text{R}\) | Energy use intensity/number of rooms | kWh/room |
Energy benchmarking models
Energy benchmarking models were determined by multiple linear regression, according to the generic model presented in equation (1):
\[ Y= a + b_1X_1 + b_2X_2 + b_3X_3 + \dots + b_nX_n,\]
where \(Y\) is the response variable, \(a\) is the linear coefficient of the regression model, \(b_i\), \(i=\in\{1, \dots, n\}\) are the angular coefficients of the independent variables, and \(X_j,~j=\in\{1, \dots, n\}\) are the independent variables.
Benchmarking models included energy consumption, EUI, EUI\(_\text{RA}\), EUI\(_\text{RN}\), and EUI\(_\text{R}\) as response variables. Pearson’s correlation analysis was used to determine which variables from the collected data, Table 1, would serve as independent variables \((X_1,~X_2,~X_3,~\dots, X_n\)), following Ding & Liu, 2020. Correlation analysis was performed to identify which factors most impacted energy consumption and EUI indicators. As stated by Barbetta et al., 2010, Pearson’s coefficient (\(r\)) describes the linear correlation between two random variables. \(r\) values range from -1 to 1, with more negative or more positive values denoting stronger correlations and a value of zero indicating a lack of correlation. According to Gori, 2017, \(r\) values between -1 and -0.9 and between 0.9 and 1 represent very strong correlations, whereas values of -0.9 to -0.6 and 0.6 to 0.9 indicate strong correlations.
Thus, Pearson’s correlation analysis was used to assess linear correlations between dependent variables (energy consumption, EUI, EUI\(_\text{RA}\), EUI\(_\text{RN}\), and EUI\(_\text{R}\)) and independent variables (built-up area, number of rooms, number of beds, number of room nights, total room area, average room area, number of floors, and shape factor). To prevent biased correlations, we avoided relating variables from the same database, such as using EUI as the dependent variable (\(Y\)) and built-up area as the independent variable (\(X\)). Additionally, for number of room nights, given that values differed across years, we assessed correlations only within the same year. For instance, the EUI of 2019 was correlated with the number of room nights sold in 2019.
Correlations classified as strong or very strong were used as a starting point for benchmarking models. As in the study of Bohdanowicz & Martinac, 2007, models initially included a wide range of parameters and were later refined, as non-significant parameters were excluded. Some variables were retained in the model even if they did not have high absolute \(r\) values, as also performed by Bohdanowicz & Martinac, 2007. Because the sample size was small, it was necessary to use data from 2019, 2020, and 2021. This procedure increased the number of observations and degrees of freedom, thereby ensuring the statistical validity of regressions.
As previously mentioned, EUI\(_\text{RN}\) represents the ratio of energy consumption to number of room nights. As these are the only two variables in the dataset that exhibited different values over the three analyzed periods, any model including EUI\(_\text{RN}\) as a response variable would need to display the equivalent values for the dependent variables in the three years. By feeding the model with fixed values, it would provide the same EUI\(_\text{RN}\) value in all years. Given this, it was deemed unfeasible to adopt this indicator as an actual representation of energy consumption. Therefore, we did not include EUI\(_\text{RN}\) as a response variable in the benchmarking models. Furthermore, all models providing the best results included number of room nights as an independent variable. During model construction, variables could be represented in various linear forms. For example, EUI could be expressed as EUI, ln(EUI), or 1/EUI. Different linear forms were tested using R software version 4.0.4 (R, 2021). The best-fit equation was chosen based on the coefficient of determination (\(R^2\)).
Because of the small sample size, it was not possible to construct a probability distribution graph, thereby limiting the full application of the classification scales proposed by Ding & Liu, 2020; Veloso et al., 2020, which are based on gamma and normal distributions, respectively. Thus, a method adapted from Veloso et al., 2020 was used, given that the present dataset did not meet normality assumptions. The proposed classification is based on the mean (\(\mu\)) and standard deviation (\(\sigma\)) of performance indicators, and results are categorized into five classes, namely A, B, C, D, and E, as expressed in Table 3. Class A represents the best energy efficiency and Class E, the worst. Building classification was carried out using 2019 data to exclude any influence of the COVID-19 pandemic on energy consumption.
| Class | Lower Limit | Upper Limit |
|---|---|---|
| A | - | \(\mu-0.843\sigma\) |
| B | \(\mu - 0.843\sigma\) | \(\mu - 0.245\sigma\) |
| C | \(\mu - 0.245\sigma\) | \(\mu + 0.245\sigma\) |
| D | \(\mu + 0.245\sigma\) | \(\mu + 0.843\sigma\) |
| E | \(\mu + 0.843\sigma\) | - |
Adapted from “Energy benchmarking for office building towers in mild temperate climate”, by A. C. O. Veloso, R. V. G. Souza, and F. N. Santos, 2020, Energy and Buildings, 222, p. 12–14.
Results and Discussion
Characterization of energy consumption of hotels in Londrina xxxxxxxxxxxxx
Table 4 shows the characteristics of the five hotel buildings and their 2019 energy consumption data. Even though H1 was the tallest building, with 17 floors, it had the smallest built-up area (4,553.88 m\(^2\)). H2 had the largest built-up area, with 6,561.57 m\(^2\). Of note, H5, the hotel with the largest number of rooms, did not have elevators, a fact that significantly influences energy consumption. The energy consumption, occupancy, and performance data shown in Table 4 refer to the year 2019. Total energy consumption ranged from 212,664 kWh/year in H1 to 642,307 kWh/year in H4. H4 had the second largest area and number of rooms and ranked first in energy consumption, indicating opportunities for energy savings.
The highest EUI, EUI\(_\text{RA}\), and EUI\(_\text{RN}\) were observed in H4, and H2 had the highest EUI\(_\text{R}\). The lowest EUI and EUI\(_\text{RA}\) were observed in H1, which is a strong indication of good energy performance. H5 had the lowest EUI\(_\text{RN}\) (11.84), explained by its second lowest energy consumption and third highest number of room nights.
The hotels with the highest occupancy rates had the highest energy consumption density. Figure 1 depicts the association between occupancy and EUI. EUI was found to vary with occupancy.
| H1 | H2 | H3 | H4 | H5 | ||
| Built-up area (m\(^2\)) | 4,553.88 | 6,561.57 | 5,750.83 | 6,391.82 | 4,905.90 | 5,632.80 |
| Nº of floors | 17 | 7 | 12 | 6 | 4 | 9.2 |
| Nº of type floors | 12 | 3 | 10 | 4 | 1 | 6.0 |
| Nº of basements | 2 | 1 | - | - | 1 | 0.8 |
| Nº of elevators | 2 | 2 | 3 | 3 | - | 2.0 |
| Nº of rooms | 82 | 95 | 88 | 122 | 130 | 103 |
| Ceiling height of | ||||||
| the type floor (m) | ||||||
| Average room | ||||||
| area (m\(^2\)) | ||||||
| Nº of beds | 164 | 142 | 191 | 165 | 208 | 174 |
| Shape factor | 0.32 | 0.19 | 0.24 | 0.25 | 0.33 | 0.27 |
| Mortar | Mortar coating | Mortar | Mortar | |||
| coating | and ceramic tiles | coating | coating | |||
| Solar orientation | East | Northeast | South | Southeast | Northwest | - |
| Type of air | - | |||||
| conditioning system | ||||||
| Year of plan | - | |||||
| approval | ||||||
| Irregular | Irregular | |||||
| quadrilateral | quadrilateral | |||||
| Predominant | ||||||
| facade color | ||||||
| Energy consumption | ||||||
| (kWh/year) | ||||||
| EUI | 46.70 | 79.50 | 52.12 | 100.49 | 57.02 | 67.17 |
| kWh/(m\(^2\cdot\)year) | ||||||
| EUI\(_\text{RA}\) | 10.58 | 17.21 | 12.18 | 22.58 | 16.39 | 15.79 |
| kWh/(m\(^2\cdot\)year) | ||||||
| EUI\(_\text{RN}\) | 15.03 | 21.99 | 15.82 | 22.85 | 11.84 | 17.51 |
| kWh/(room night\(\cdot\)year) | ||||||
| EUI\(_\text{R}\) | 2.59 | 5.49 | 3.41 | 5.26 | 2.15 | 3.78 |
| kWh/(room\(\cdot\)year) | ||||||
| Nº of room nights | 14,152 | 23,722 | 18,946 | 28,104 | 23,634 | 21,711 |
| (nights/year) | ||||||
| Occupancy rate | 0.47 | 0.68 | 0.59 | 0.63 | 0.50 | 0.58 |
EUI: energy use intensity per built-up area; EUI\(_\text{RA}\): energy use intensity per room area; EUI\(_\text{RN}\): energy use intensity per room night; EUI\(_\text{R}\): energy use intensity per number of rooms.

Given the social restrictions brought by the COVID-19 pandemic, there was a 35.42 % decrease in total energy consumption from 2019 to 2020. Figure 2 shows the monthly distribution of energy consumption in 2019–2021. Although there was a remarkable recovery in occupancy, energy consumption levels in 2021 did not return to pre-pandemic values. A follow-up study would be important to update these findings.
Figure 2 also depicts a reduction in energy consumption during the winter of 2019 and 2021. Such a reduction is explained by the lower need for air cooling. This finding suggests that air conditioning is responsible for a significant portion of energy consumption, as indicated by Buso & Corgnati, 2017; Cunha & Oliveira, 2020 and CBCS (). Considering that a higher number of room nights possibly translates into a greater demand for air conditioning, we infer a direct connection between occupancy rate and total energy consumption in hotels.

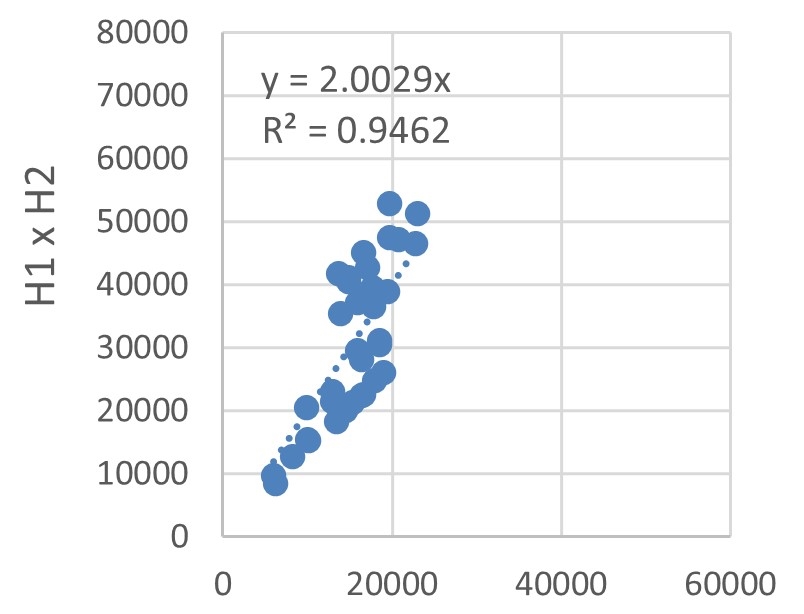
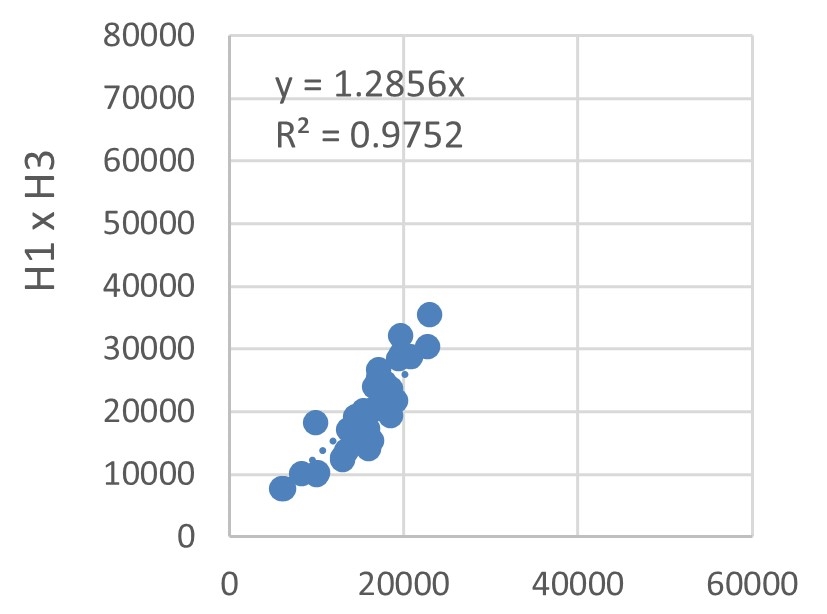
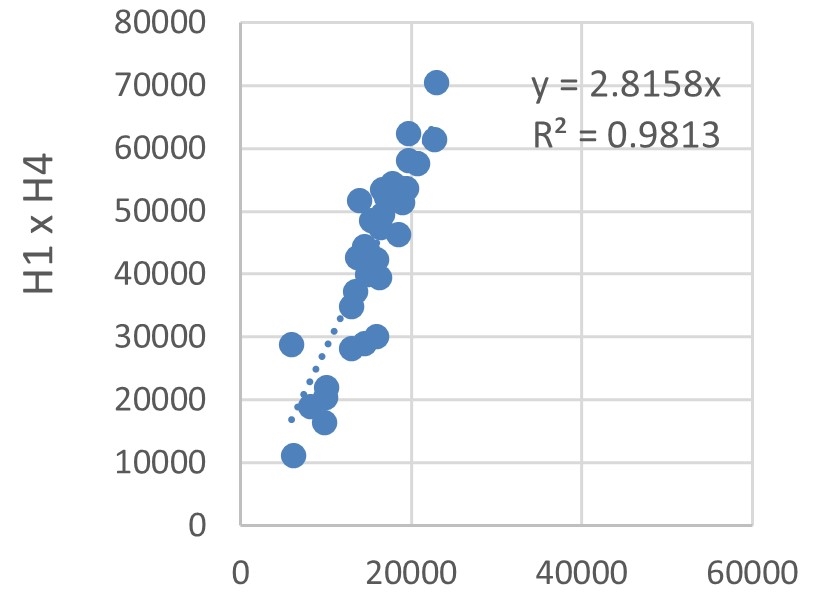
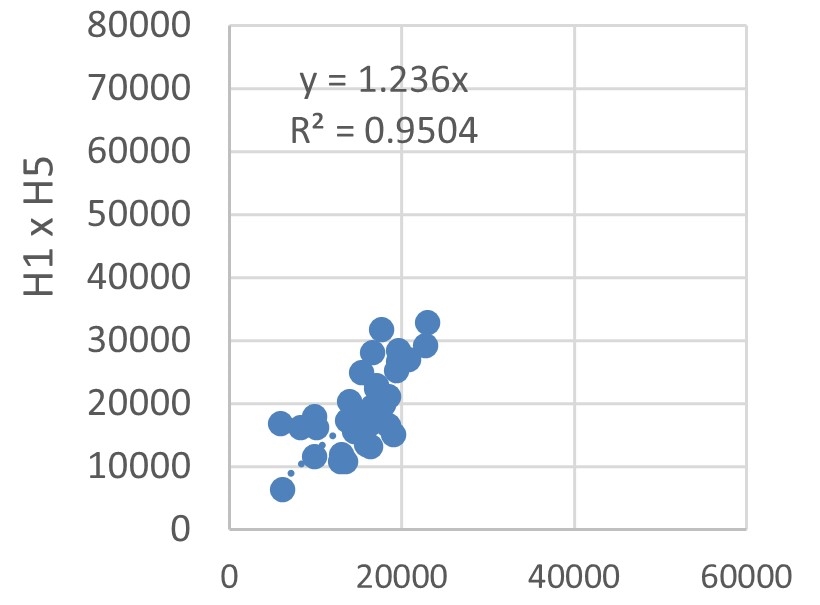
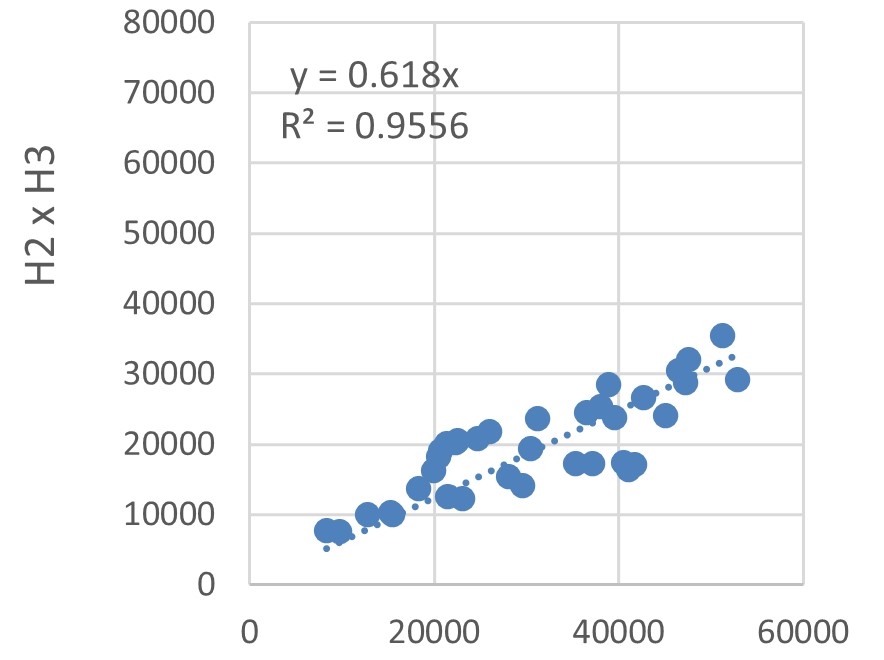
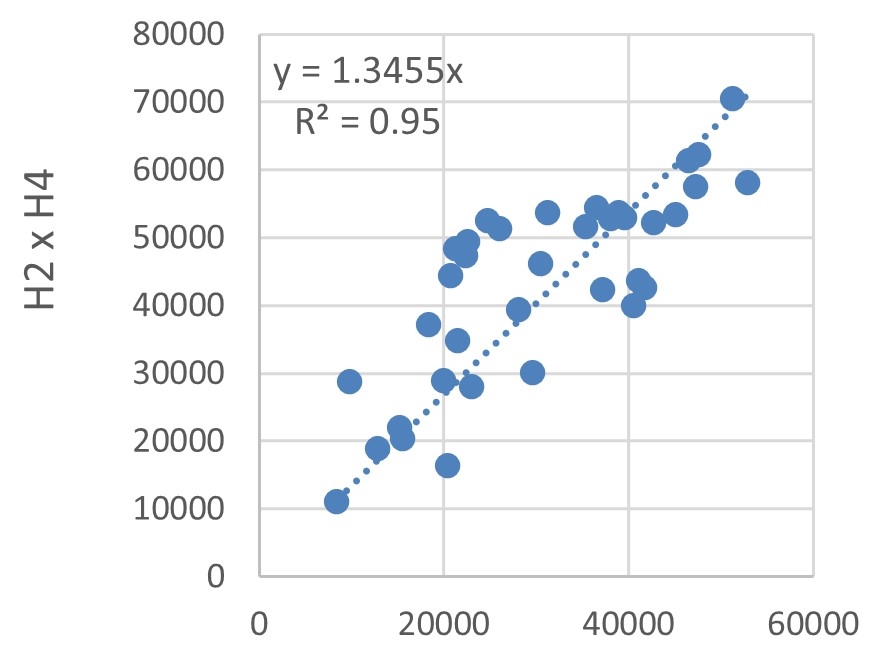
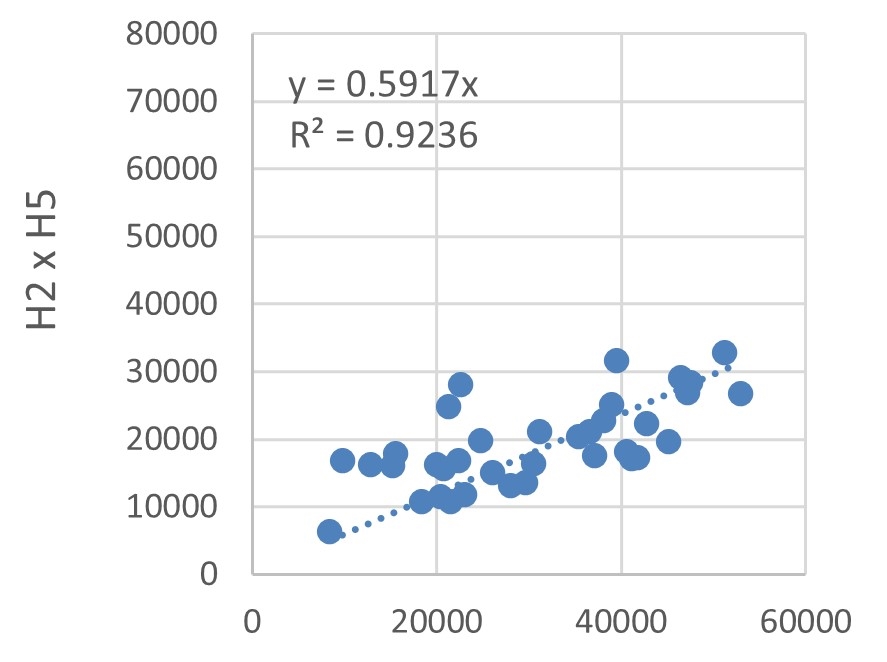
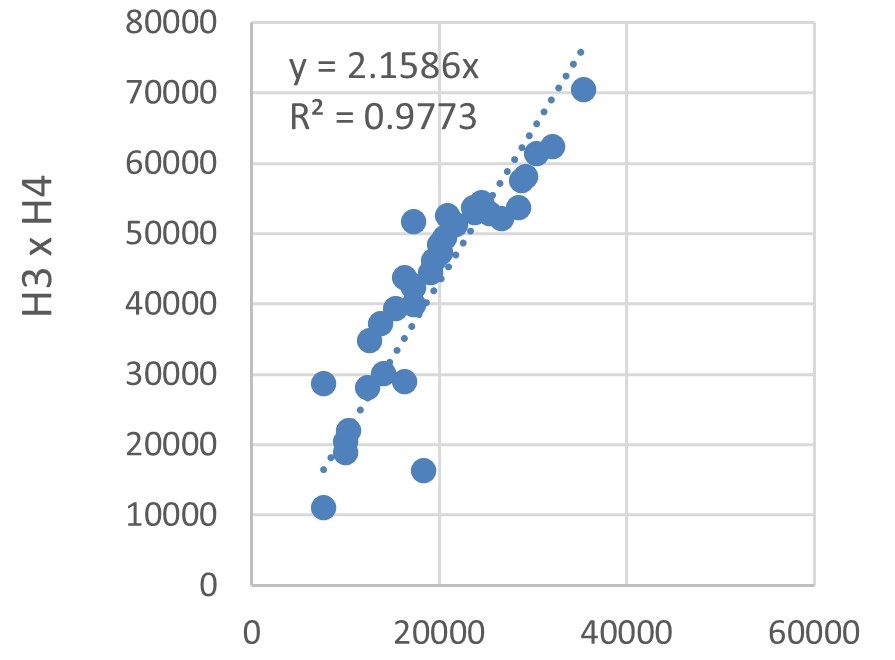
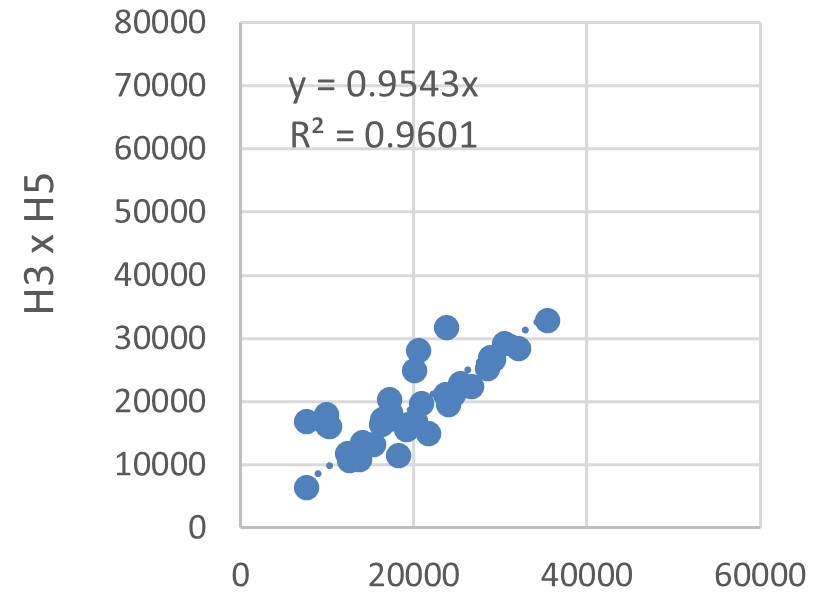
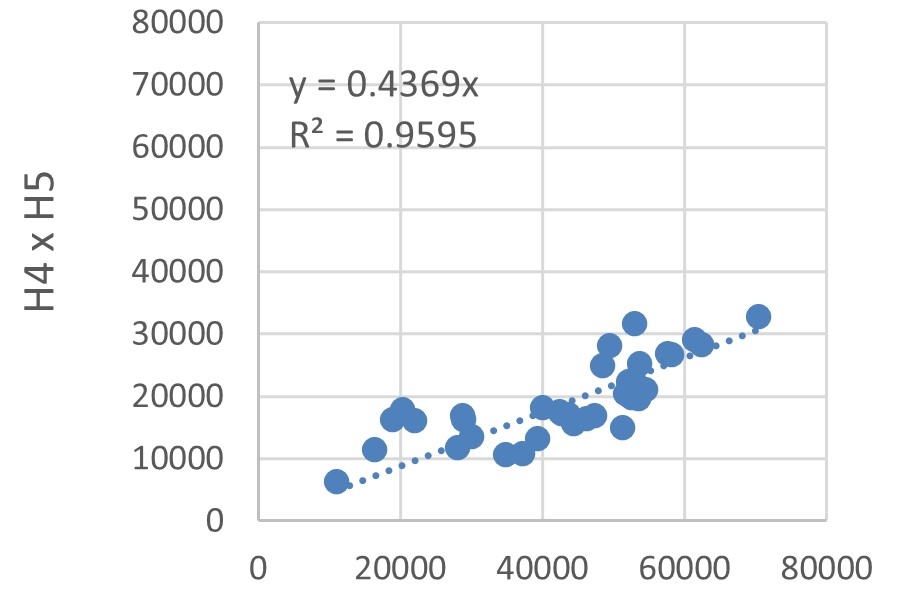
The energy consumption of each hotel was compared using dispersions, as depicted in Figure 12. Trend lines with defined intersections were used to identify the correlations between energy consumptions by estimating the \(R^2\).
The lowest \(R^2\) was 0.9236, obtained for the dispersion explaining the correlation between H2 and H5 energy consumptions, illustrated in Figure 12(g). Albeit being the lowest, this \(R^2\) value indicates a very strong correlation. Hotel buildings typically have a large fluctuation in energy demand, owing to the random operating conditions of rooms, as explained by Chen et al., 2017. Nevertheless, the high \(R^2\) values, Figures 12(a)-(h) and Figure 12(i), indicate that the sample buildings are subject to the same factors influencing variations in energy consumption.
| (a) | ||
 | ||
| (b) | (c) | |
 |  | |
| (d) | ||
 | ||
| (e) | (f) | |
 |  | |
| (g) | ||
 | ||
| (h) | (i) | |
 |  | |
| (j) | ||
 |
Energy use indicators
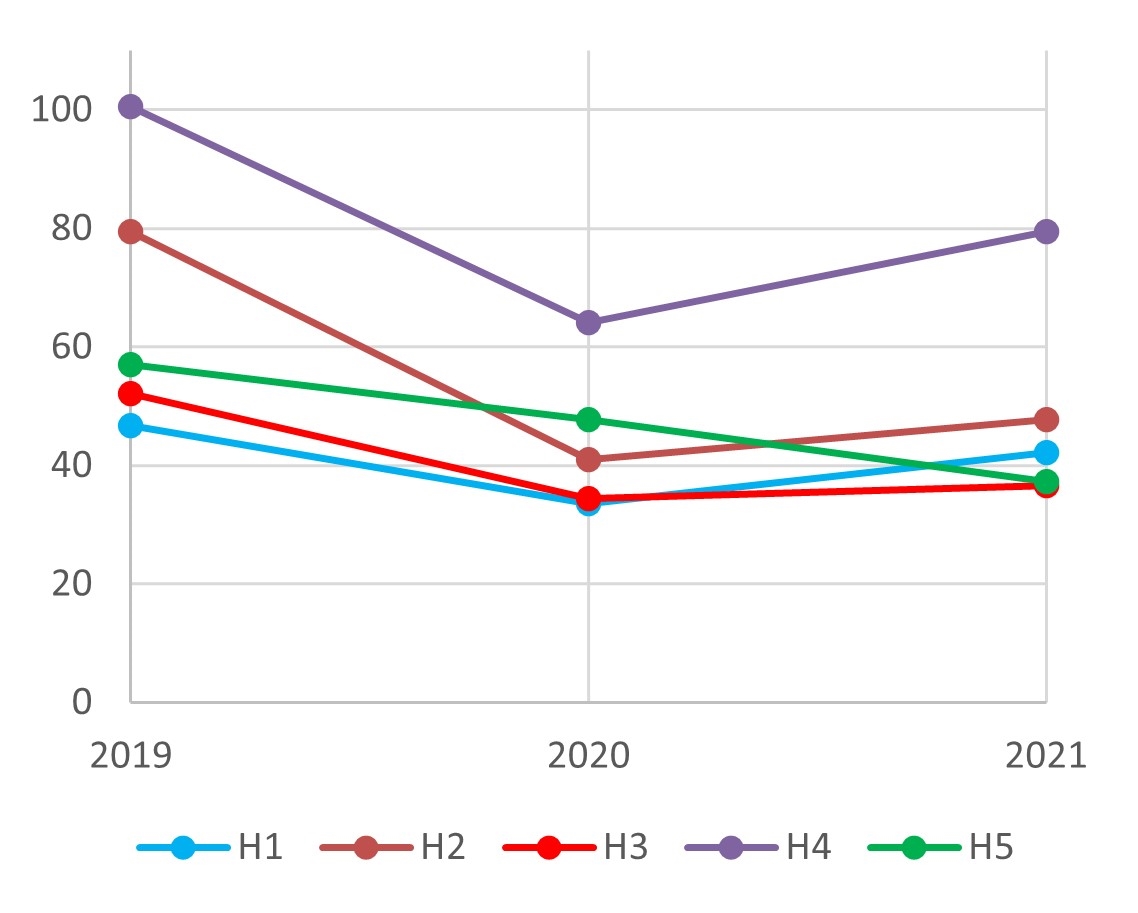
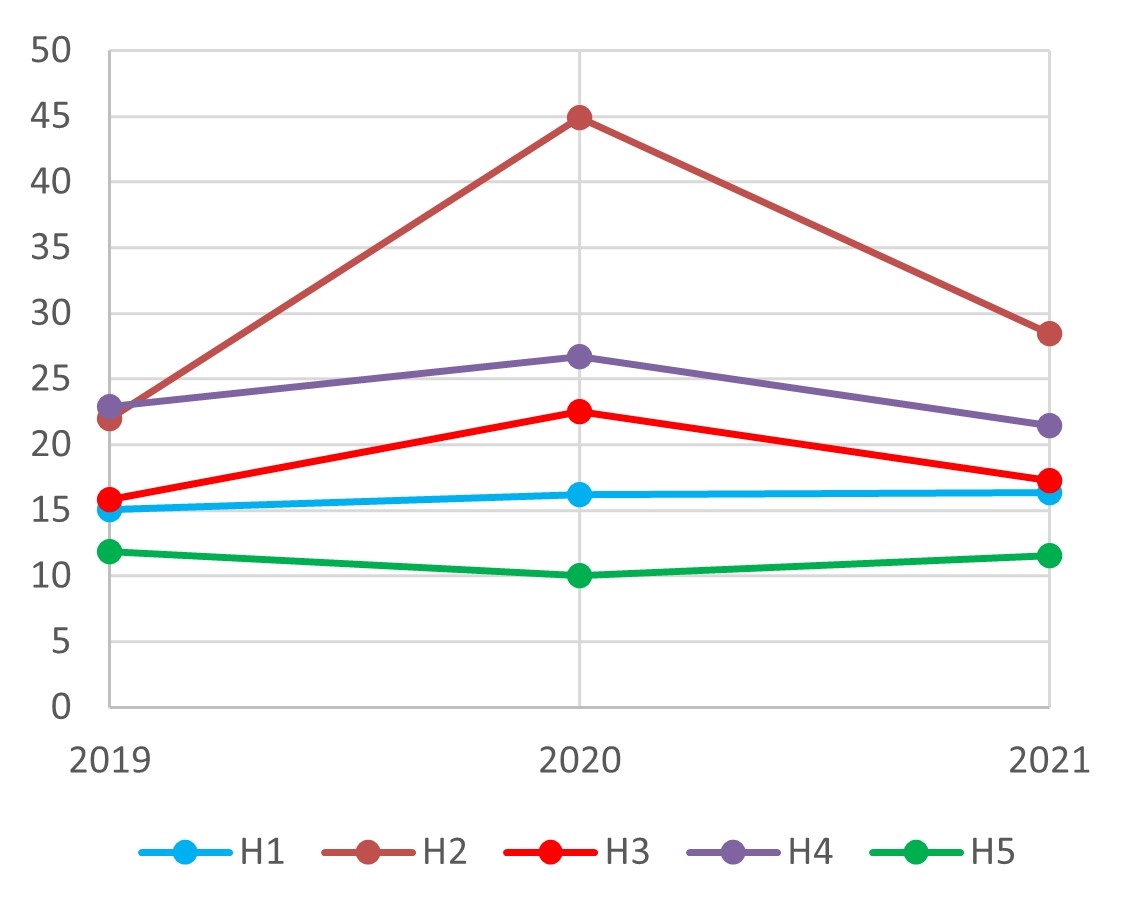
The energy performance indicators of hotel buildings were calculated using 2019, 2020, and 2021 data with the aim of evaluating their behavior in atypical consumption situations, as occurred in 2020. The results are shown in Figure 16.
| (a) | (b) |
 |  |
| (c) | (d) |
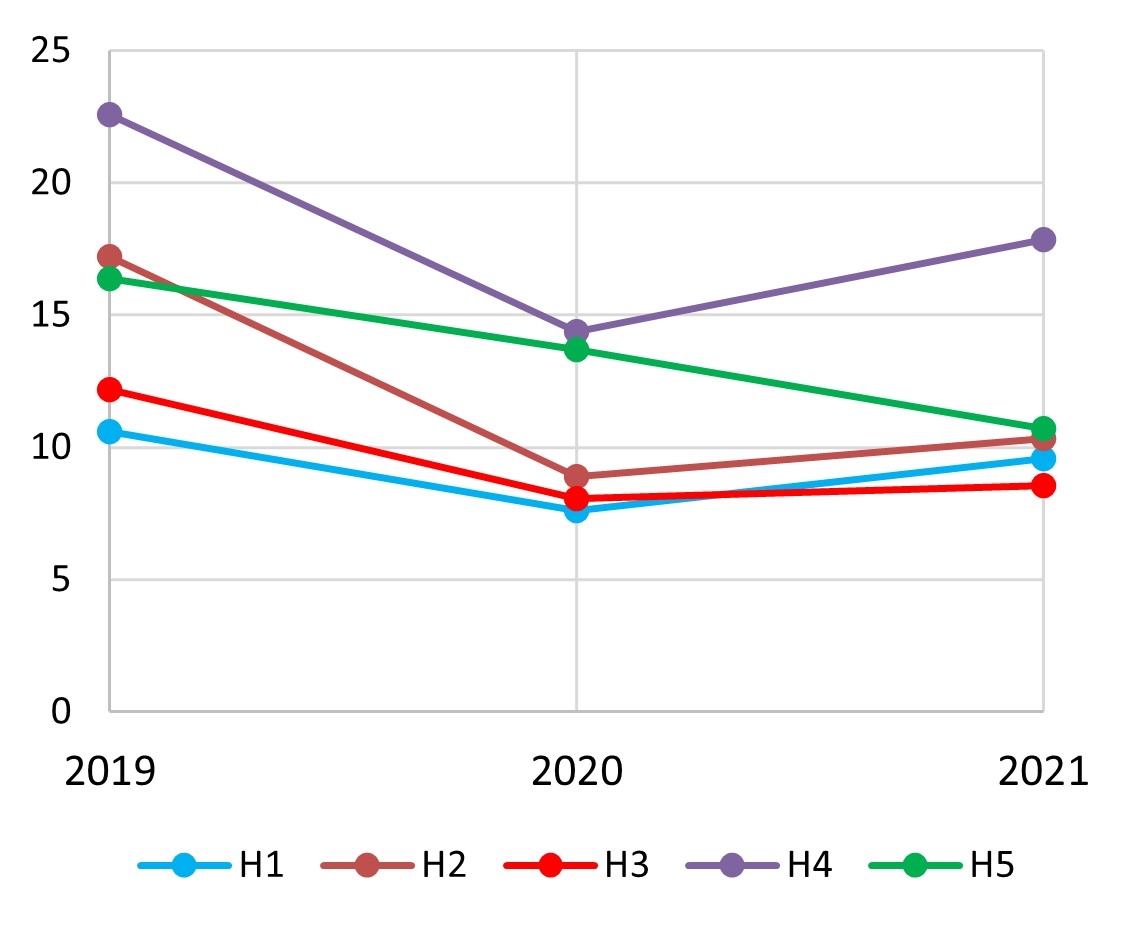 | 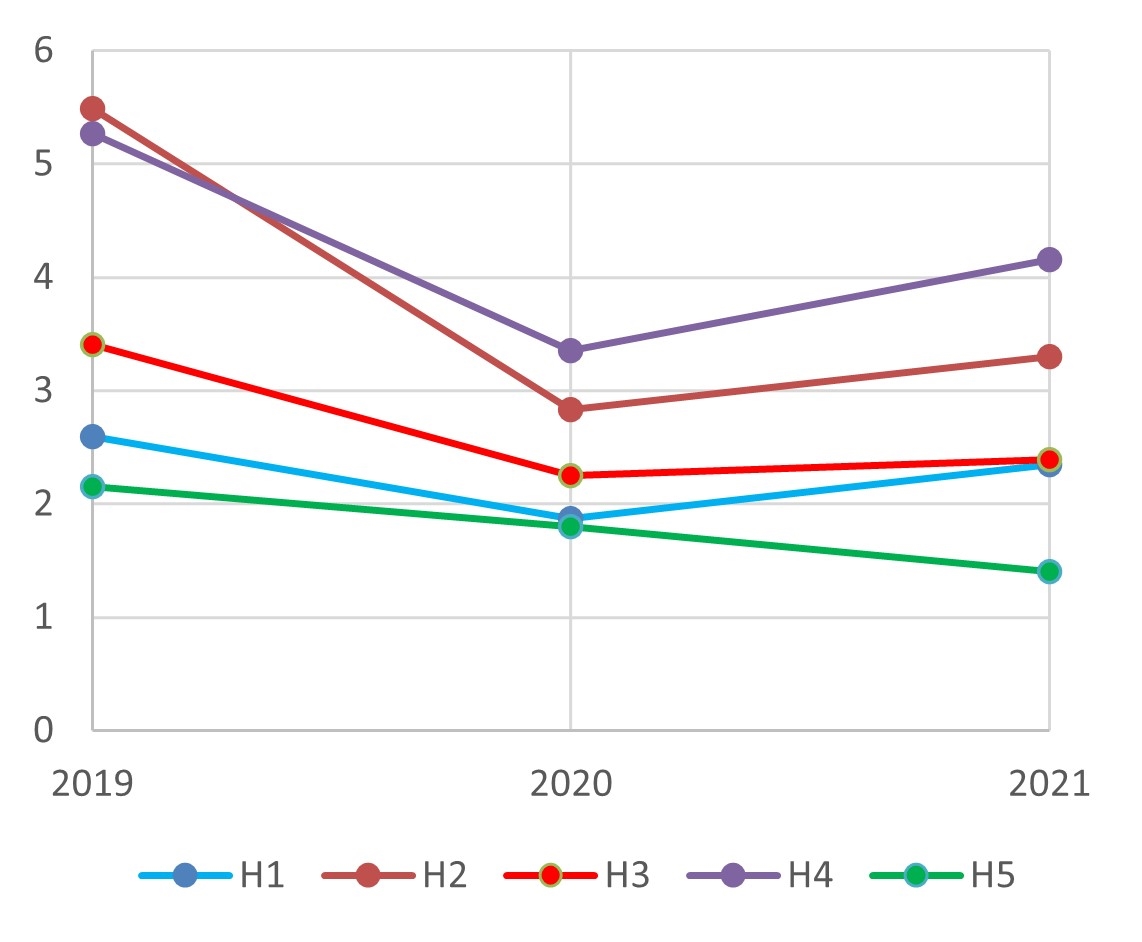 |
In Figure 16(a), (c), and (d), the area, average room area, and number of rooms of each hotel were the same over the three years; therefore, the indicators varied according to energy consumption. Figure 16(b) depicts the relationship between energy consumption and room nights, which varied over time. Except in H2, EUI\(_\text{RN}\) did not vary much over the years. This finding shows that EUI\(_\text{RN}\) is a good energy performance indicator, as it remained stable despite the marked variation in energy consumption in 2020.
Hotels have a baseline energy consumption that is not related to occupancy, including factors such as air conditioning, artificial lighting, and equipment in common areas and administrative sectors of the hotel. In considering EUI\(_\text{RN}\), the greater the number of room nights, the lower the contribution of baseline consumption to total energy consumption. Therefore, the large increase in EUI\(_\text{RN}\) in H2 observed in 2020 can be explained by the greater contribution of baseline consumption. Because of the COVID-19 pandemic, the number of room nights sold in H2 decreased by 74.70 % from 2019 to 2020.
In the four analyses, H2 and H4 had the highest energy consumption indicators, suggesting poor energy performance. H1 and H3, by contrast, were the most energy efficient, as evidenced by their low energy consumption indicators.
Energy benchmarking models
Pearson’s coefficient analysis was used to select independent variables for composing benchmarking models. The following variables were found to be strongly or very strongly correlated: energy consumption with built-up area and total room area; EUI with total room area; EUI\(_\text{RN}\) with built-up area, number of beds, average room area, and shape factor; EUI\(_\text{RA}\) with room nights; and EUI\(_\text{R}\) with built-up area and shape factor. Using R software (R, 2021), we found that linear regression models provided the highest \(R^2\) values and, consequently, the best fits. Table 5 shows the four models and their respective \(R^2\) values.
| Model | Equation | \(R^2\) |
|---|---|---|
| Model 1 | \(\text{ln}\left(Y_1\right)=10.377+0.0000448X_1+0.0596409X_2\) | 0.97 |
| Model 2 | \(\text{ln}\left(Y_2\right)=4.402900+0.0000460X_1-0.0071100(1/X_3)\) | 0.91 |
| Model 3 | \(\text{ln}\left(Y_3\right)=-0.204580+0.0000438X_1+618.8674169X_3\) | 0.92 |
| Model 4 | \(Y_4=7569.959616 + 0.1274485X_1 - 38.3998397X_3\) | 0.81 |
\(X_1\): room nights (room nights/year); \(X_2\): average room area (m\(^2\)); \(X_3\): number of beds (units/year); \(Y_1\): energy consumption (kWh/year); \(Y_2\): energy use intensity per built-up area (EUI, kWh/(m\(^2\cdot\)year)); \(Y_3\): energy use intensity per average room area (kWh/(m\(^2\cdot\)year)); \(Y_4\): energy use intensity per number of rooms (kWh/(room\(\cdot\)year)).
The best models are those with an \(R^2\) value close to 1. Models 1, 2, and 3 provided the best fits to the data, with \(R^2\) values of 0.97, 0.91, and 0.92, respectively. Nevertheless, Model 4, with an \(R^2\) of 0.81, may also be considered a good tool for describing energy consumption in this sample, as its \(R^2\) value is close to or higher than the values reported by Ding & Liu, 2020; Cunha & Oliveira, 2020; Nguyen & Rockwood, 2019; Chen et al., 2017, CBCS (), Geraldi & Ghisi, 2020; Gnecco, 2021; Borgstein & Lamberts, 2014.
Addition of other independent variables did not improve the fit of the model, obviating the need for further data collection. The fact that the models contained only two independent variables is an advantage, facilitating their application by hotel managers. The model can contribute to financial planning by predicting energy consumption and can provide a quick perception of energy performance in comparison with other hotels. Furthermore, the data can help identify opportunities to improve energy efficiency. Given that the model relates energy consumption and occupancy rate, managers may gain insight into the impact of room nights on total energy consumption.
Despite the small sample size, this study used measured data for defining benchmarking models through multiple linear regression. Similar methods were adopted by Bohdanowicz & Martinac, 2007; Lu et al., 2013; Ding & Liu, 2020. Energy consumption simulation is advantageous for expanding datasets and analyzing the individual influence of parameters on total energy consumption. However, as discussed by Yan et al., 2015, there is a gap between measured and simulated energy performance, as simulations cannot always predict operational problems and individual characteristics of use.
Energy performance rating
The upper and lower limits of each energy performance class are shown in Table 6, and the ratings of the five hotels are described in Table 7. Model 1 was not used in this analysis, as the dependent variable of the model was energy consumption. The model does not encompass other building properties, which could impair the analysis of hotel energy performance. Therefore, Model 1 was used only as a prediction tool for energy consumption.
| Lower | Upper | Lower | Upper | Lower | Upper | |||
| A | - | 36.86 | - | 8,920 | - | 1,955 | ||
| B | 36.87 | 48.56 | 8,921 | 11,517 | 1,956 | 2,679 | ||
| C | 48.57 | 58.15 | 11,518 | 13,644 | 2,680 | 3,273 | ||
| D | 58.16 | 69.89 | 13,645 | 16,249 | 3,274 | 3,999 | ||
| E | 69.90 | - | 16,250 | - | 4,000 | - | ||
| Mean (\(\mu\)) | ||||||||
| Standard deviation (\(\sigma\)) |
EUI: energy use intensity per built-up area; EUI\(_\text{RA}\): energy use intensity per average room area; EUI\(_\text{RN}\): energy use intensity per room night; EUI\(_\text{R}\): energy use intensity per number of rooms.
| Value | Class | Value | Class | Value | Class | |||
| H1 | 46.70 | B | 10,576.87 | B | 2,593.46 | B | ||
| H2 | 79.50 | E | 17,214.51 | E | 5,491.25 | E | ||
| H3 | 52.12 | C | 12,177.20 | C | 3,406.00 | D | ||
| H4 | 100.49 | E | 22,583.93 | E | 5,264.81 | E | ||
| H5 | 57.02 | C | 16,394.15 | E | 2,151.80 | B | ||
| Mean (\(\mu\)) | ||||||||
| Standard deviation (\(\sigma\)) |
EUI: energy use intensity per built-up area; EUI\(_\text{RA}\): energy use intensity per average room area; EUI\(_\text{RN}\): energy use intensity per room night; EUI\(_\text{R}\): energy use intensity per number of rooms.
The classification scale was deemed effective, given that H1, H2, and H4 were placed in the same class, even when using different models. H1 was classified in category B, and H2 and H4 in E (worst performance). These findings agree with the data for 2019, 2020, and 2021 shown in Figure 16 and Table 4. The consistently high energy performance indicators of H2 and H4 suggest several opportunities for energy savings.
In Figure 16 and Table 7, it is shown that the energy performance class of H3 and H5 differed according to the model. This result demonstrates the complexity of energy efficiency analysis for hotel buildings and the importance of carrying out local benchmarking under real conditions.
In view of the high \(R^2\) values in Table 5, the performance classification of Table 7, and the agreement with individual energy consumption data of hotels, we conclude that Models 2, 3, and 4 are adequate for energy benchmarking. The variations in the performance classes of H3 and H5 demonstrate that several performance indicators can be used to represent the energy consumption of hotel buildings, as suggested by Bohdanowicz & Martinac, 2007; Wang, 2012; Lu et al., 2013; Ding & Liu, 2020, and ENA (). Such indicators may be chosen according to the focus of the study.
Conclusion
This study assessed benchmarking models for hotels in Londrina, Paraná State, with the aim of classifying the operational energy performance of hotels and defining an energy consumption estimation tool for managers. For this, data on annual energy consumption, number of room nights sold in 2019, 2020, and 2021, and building characteristics of five hotels of medium and high-quality standards were analyzed. Four types of indicators were calculated for sample analysis, namely EUI, EUI\(_\text{RN}\), EUI\(_\text{RA}\), and EUI\(_\text{R}\), and different benchmarking models were constructed using linear regression.
One of the studied hotels was categorized into energy performance class B by all models, suggesting good management of energy resources. In this case, improving the efficiency of the air conditioning system and elevators could contribute to reaching level A. By contrast, two hotels were categorized in class E by all models, indicating that they have several opportunities for energy savings. The higher average room area combined with the low thermal performance of the hotel with a glass facade might have contributed to its high energy consumption. Another important factor contributing to poor energy performance is the inefficiency of air conditioning systems.
In the data collection stage, we found it difficult to engage with managers and gain their participation, representing a limitation of this study. We also encountered challenges in assessing the physical characteristics of buildings, as some plans were outdated, and it was necessary to collect as-built data on site.
Despite the small sample size, there was a good correlation between variables, with \(R^2\) values of 0.97, 0.91, 0.92, and 0.81 for models including energy consumption, EUI, EUI\(_\text{RA}\), and EUI\(_\text{R}\) as response variables, respectively. The EUI-based model had the best applicability for the study sample. The great advantage of these equations is the use of only two variables that are routinely recorded in hotel management, thereby eliminating the need for extensive data surveys. Therefore, the tool is easy to use for technicians and laypeople and allows managers to gain insight into the energy performance of hotels.
Future research should verify the applicability of coefficients found here in samples with a greater number of observations.
Author contributions
Guerra, M. R. participated in: conceptualization, data curation, formal analysis, investigation, methodology and writing - original draft. Zara, R. B. participated in: writing - revision and editing. Giglio, T. G. F. participated in: supervision, validation, visualization and writing - revision and editing.
Conflicts of interest
The authors certify that no commercial or associative interest represents a conflict of interest concerning the manuscript.
References
Alzboun, N., Khawaldah, H., Allan, M. & Backman, K. (2017). Exploring the financial leakages in the classified Hotels in Jordan: a managerial perspective. 18(4), 429--443. https://doi.org/10.1080/15256480.2017.1289139
Barbetta, P. A., Reis, M. M. & Bornia, A. C. (2010). Estatistica para cursos de engenharia e informatica. UFSC.
Barros, M. V. F. B., Barros, O. N., Polidoro, M. & Pereira, A. C. F. (2021). Atlas Digital da Regiao Metropolitana de Londrina.
Boemi, S. N., Slini, T., Papadopoulos, A. M. & Mihalakakou, Y. (2011). A statistical approach to the prediction of the energy performance of hotel stock. 10(2), 163--172. https://doi.org/10.1080/14733315.2011.11683945
Bohdanowicz, P. & Martinac, I. (2007). Determinants and benchmarking of resource consumption in hotels - Case study of Hilton International and Scandic in Europe. 39(1), 82--95. https://doi.org/10.1016/j.enbuild.2006.05.005
Borgstein, E. & Lamberts, R. (2014). Desenvolvimento de benchmarks nacionais de consumo energetico de edificacoes em operacao. Conselho Brasileiro de Construcao Sustentavel.
Lei nº 13.709, de 14 de agosto de 2018 (2018). Dispõe sobre a Lei Geral de Protecao de Dados Pessoais (LGPD). Diario Oficial da Uniao.
Buso, T. & Corgnati, S. P. (2017). A customized modelling approach for multi-functional buildings – Application to an Italian Reference Hotel. 302--1315. https://doi.org/10.1016/j.apenergy.2017.01.042
Conselho Brasileiro de Construção Sustentável (2021a). RT2A.03 - Relatório de Auditorias Energéticas - Tipologia de Hotel Vertical de Médio e Grande Porte.
Conselho Brasileiro de Construção Sustentável (2021b). RT2B.03 - Desenvolvimento de arquétipo, modelo de simulação, análise de sensibilidade e equações de benchmark para a tipologia de Hotel Vertical de Médio e Grande Porte.
Chedwal, R., Mathur, J., Agarwal, G. D. & Dhaka, S. (2015). Energy saving potential through Energy Conservation Building Code and advance energy efficiency measures in hotel buildings of Jaipur City, India. 282--295. https://doi.org/10.1016/j.enbuild.2015.01.066
Chen, Y., Tan, H. & Berardi, U. (2017). Day-ahead prediction of hourly electric demand in non-stationary operated commercial buildings: A clustering-based hybrid approach. 228--237. https://doi.org/10.1016/j.enbuild.2017.05.003
Chung, W. (2011). Review of building energy-use performance benchmarking methodologies. 88(5), 1470--1479. https://doi.org/10.1016/j.apenergy.2010.11.022
Cunha, F. O. & Oliveira, A. C. (2020). Benchmarking for realistic nZEB hotel buildings. 1--13. https://doi.org/10.1016/j.jobe.2020.101298
Deng, S. M. & Burnett, J. (2000). A study of energy performance of hotel buildings in Hong Kong. 31(1), 7--12. https://doi.org/10.1016/S0378-7788(98)00067-X
Ding, Y., Zhang, Z., Zhang, Q., Lv, W., Yang, Z. & Zhu, N. (2018). Benchmark analysis of electricity consumption for complex campus buildings in China. 428--436. https://doi.org/10.1016/j.applthermaleng.2017.12.02
Ding, Y. & Liu, X. (2020). A comparative analysis of data-driven methods in building energy benchmarking. 1--13. https://doi.org/10.1016/j.enbuild.2019.109711
Energy & Environment Agency of Arrábida [ENA] (2020). Guia de boas práticas: conjunto de medidas, informações e boas práticas para uma maior eficiência energética no setor hoteleiro.
Geraldi, M. S. & Ghisi, E. (2020). Mapping the energy usage in Brazilian public schools. 1--17. https://doi.org/10.1016/j.enbuild.2020.110209
Gnecco, V. (2021). Desenvolvimento de um modelo de benchmarking local para as escolas públicas de ensino infantil de Florianópolis.
Gori, A. M. (2017). Econometria Conceitos e Aplicações. Saint Paul.
Instituto de Desenvolvimento Rural do Paraná (2019). Temperaturas Médias Históricas na Estação de Londrina - PR.
Jota, P. R. da S., de Souza, A. P. & da Silva, V. R. (2017). Energy performance indexes: analysis in public schools in Brazil. 1433--1451. https://doi.org/10.1007/s12053-017-9530-7
Juaidi, A., Alfaris, F., Montoya, F. G. & Manzano-Agugliaro, F. (2016). Energy benchmarking for shopping centers in Gulf Coast region. 247--255. https://doi.org/10.1016/j.enpol.2016.01.012
Katircioglu, S., Saqib, N. & Katircioglu, S. (2020). Estimating the effects of tourism growth on emission pollutants: empirical evidence from a small island, Cyprus. 13(4), 391--397. https://doi.org/10.1007/s11869-020-00803-z
Lu, S., Wei, S., Zhang, K., Kong, X. & Wu, W. (2013). Investigation and analysis on the energy consumption of starred hotel buildings in Hainan Province, the tropical region of China. 570--580. https://doi.org/10.1016/j.enconman.2013.07.008
Nguyen, A. T. & Rockwood, D. (2019). Developing an energy benchmarking system for hotel buildings using the statistical method and the simulation-based approach. 14(3), 3--22. https://doi.org/10.3992/1943-4618.14.3.1
Peel, M. C., Finlayson, B. L. & Mcmahon, T. A. (2007). Updated world map of the Köppen-Geiger climate classification. 1633--1644. https://doi.org/10.5194/hess-11-1633-2007
Prefeitura de Londrina (2022). Certidão Narrativa de Lançamento de IPTU.
R Core Team (2021). A language and environment for statistical computing.
RosselloBatle, B., Moia, A., Cladera, A. & Martinez, V. (2010). Energy use, CO2 emissions and waste throughout the life cycle of a sample of hotels in the Balearic Islands. 42(4), 547--558. https://doi.org/10.1016/j.enbuild.2009.10.024
Roth, J. & Rajagopal, R. (2018). Benchmarking building energy efficiency using quantile regression. 866--876. https://doi.org/10.1016/j.energy.2018.02.108
Tang, M., Fu, X., Cao, H., Shen, Y., Deng, H. & Wu, G. (2016). Energy Performance of Hotel Buildings in Lijiang, China. 8(8), 780. https://doi.org/10.3390/su8080780
Veloso, A. C. O., Souza, R. V. G. & Santos, F. N. (2020). Energy benchmarking for office building towers in mild temperate climate. 12--14. https://doi.org/10.1016/j.enbuild.2020.110059
Wang, J. C. (2012). A study on the energy performance of hotel buildings in Taiwan. 268--275. https://doi.org/10.1016/j.enbuild.2012.02.016
Yan, D., O’Brien, W., Hong, T., Feng, X., Gunay, H. B., Tahmasebi, F. & Mahdavi, A. (2015). Occupant behavior modeling for building performance simulation: Current state and future challenges. 264--278. https://doi.org/10.1016/j.enbuild.2015.08.032
Yao, Z., Zhuang, Z. & Gu, W. (2015). Study on energy use characteristics of hotel buildings in Shanghai. 1977--1982. https://doi.org/10.1016/j.proeng.2015.09.195
Yuan, Z., Wang, W., Wang, H. & Mizzi, S. (2020). Combination of cuckoo search and wavelet neural network for midterm building energy forecast. 1--15. https://doi.org/10.1016/j.energy.2020.117728

