
Simultaneous HPLC/UV Detection of Sulfonamides in Milk Using Fabric Phase Sorptive Extraction

DOI 10.5433/1679-0375.2024.v45.49727
Citation Semin., Ciênc. Exatas Tecnol. 2024, v. 45: e49727
Received: 22 January 2024; Received in revised for: 4 April 2024; Accepted: : 16 April 2024; Available online: 6 May 2024.
Abstract:
The fabric phase sorptive extraction technique was employed to remove of sulfamethazine and sulfamethoxazole in milk. Initially, the coating of a cotton fabric with a sol-gel solution of polyethylene glycol, aiming to use it as a substrate in adsorption. The coated and uncoated fabrics were characterized using X-ray energy dispersive spectroscopy and scanning electron microscopy, confirming the effectiveness of the coating procedure. Quantification of the analytes was conducted using high-performance liquid chromatography with ultraviolet detection, with a wavelength of 267 nm. The mobile phase that exhibited the best analytical separation and selectivity for the studied analytes in the presence of the complex milk matrix consisted of acetonitrile and water (30:70 v/v). The results of the evaluation of the removal capacity of sulfonamides were 35.30 ± 1.09 for sulfamethazine and 42.79 ± 1.68 for sulfamethoxazole, demonstrating the effectiveness of the adsorbent system and the methodology used in the extraction and detection of these compounds in milk.
Keywords: sulfonamides, milk, FPSE, HPLC/UV
Introduction
According to information from the Ministry of Agriculture, Livestock, and Supply (Mapa), Brazil ranks third globally in milk production, exceeding \(34\) billion liters annually. This substantial volume results from activities across more than one million milk-producing properties, employing approximately four million people (Ministry of Agriculture & Livestock, 2022). Significant dairy production is associated with the increased use of veterinary drugs, such as anti-inflammatories, antiparasitics, and especially antimicrobials. The latter stands out as the primary chemical contaminant in milk due to the improper use of these substances (Silva, 2018). Human exposure to residues of these contaminants, which may be present in food, can lead to various adverse effects and diseases (Khaniki, 2007; Santos, 2015).
According to the regulations established by Normative Instruction No. 62, dated December 29, 2011, from Mapa, the processing or commercialization of milk from animals undergoing treatment with veterinary medications, susceptible to elimination through milk, is prohibited (Ministry of Agriculture and Livestock, 2011). Contamination can occur due to the improper use of these medications in dairy cows. Therefore, milk originating from animals under treatment should, under no circumstances, be destined for consumption and must be discarded (Trombete et al., 2014).
Sulfonamides belong to an extensive class of antibiotics and, due to their broad-spectrum antimicrobial activity and low cost, are widely used in veterinary medicine to prevent infections in the bovine herd and treat diseases (Dost et al., 2000; Feng et al., 2019). The Brazilian Health Regulatory Agency (Anvisa) issued Normative Instruction No. 51 on December 19, 2019, setting forth Maximum Residue Limits (MRL), acceptable daily intake, and acute reference dose for active pharmaceutical ingredients found in veterinary drugs present in animal-derived food.
For milk, the combined total of residues from all substances in the sulfonamide group should not exceed \(100~\mu\text{g.kg}^{-1}\) (Brazilian Health Regulatory Agency, 2019). Therefore, commercializing milk containing residues above the MRL set by Anvisa is prohibited, considered adulterated, and unsuitable for human consumption.
Fabric Phase Sorptive Extraction (FPSE) is a sample preparation technique based on adsorption developed by Kabir & Furton, 2014. In summary, FPSE uses sol-gel coating technology to create a hybrid organic-inorganic adsorbent material combined with the surface of a porous fabric to be used as a substrate in the adsorption process (Anthemidis, 2016). The device allows anchoring a large amount of extraction adsorbent, dispersed as an ultra-thin film distributed on the substrate surface, leading to a rapid extraction equilibrium and increased analyte retention capacity (Samanidou, 2015).
A wide variety of natural and synthetic fabrics, commercially available, can be considered as potential for use in FPSE, with cotton fabric standing out. Cotton fibers consist of 98 % cellulose in their chemical composition, and various accessible active functional groups for reaction on their surface. Due to these available functional groups, cellulose can retain large amounts of sol-gel adsorbents during the coating process (Kumar, 2014; Roldan, 2015). Sol-gel chemistry offers an efficient pathway for incorporating organic components into inorganic polymeric structures. Therefore, for the preparation of the adsorbent device used in FPSE, different sol-gel chemical coatings can be applied, with short-chain Polyethylene Glycol (PEG) sol-gel standing out as a high-polarity polymer (Anthemidis, 2016).
This study, employed a simplified synthesis approach to incorporate the organic polymer PEG into the sol-gel matrix and anchor this growing sol-gel network to a hydrophilic and flexible cellulose substrate (cotton fabric). A sorption extraction medium coated with a homogeneous and ultra-thin sol-gel on the fabric surface was obtained. Within this context, we proposed the simultaneous extraction of sulfamethazine (SMZ) and sulfamethoxazole (SMX) in Ultra-High-Temperature (UHT) milk samples using the FPSE device without the need for any pre-treatment of the sample. The quantification of analytes was performed by High-Performance Liquid Chromatography (HPLC) with Ultraviolet (UV) detection.
Methods
Materials and reagents
For the execution of this work, analytical-grade reagents were employed, and HPLC-grade solvents were used for chromatographic analyses. The list of reagents and solvents used is presented below: Acetone P.A. \(99.5\) %, Proquímios; Sodium acetate P.A. \(98\) %, Synth; Acetonitrile (ACN) HPLC grade, Supelco; Acetic acid P.A. \(99.7\) %, Synth; Hydrochloric acid P.A. \(37\) %, Alphatec; Formic acid P.A. \(85\) %, Synth; Nitric acid P.A. \(65\) %, Synth; Trifluoroacetic acid P.A. \(99.8\) %, Exodus Científica; Methylene chloride P.A. \(99.5\) %, Isofar; Sodium hydroxide P.A. \(98\) %, Sigma-Aldrich; Methanol (MeOH) HPLC grade, Supelco; Methyltrimethoxysilane P.A. \(95\) %, Sigma-Aldrich; Gaseous nitrogen, Oxynobre; Sulfamethazine standard \(98\) %, Sigma-Aldrich; Sulfamethoxazole standard \(98\) %, Sigma-Aldrich; Short-chain Polyethylene Glycol (M.W. \(600\)) \(99\) %, Acros Organics; Polytetrahydrofuran \(99\) %, Sigma-Aldrich.
The fabric used as the substrate for FPSE, composed of 100 % raw cotton containing 98 % cellulose and unbleached, was acquired from a commercial source in the city of Catalão, Goiás, and produced by Têxtil Oliveira Industry in Anápolis, Goiás. UHT milk samples were obtained from local supermarkets in Catalão, Goiás. The solutions used in the experiments were all prepared using Milli-Q® ultrapure water; this water was also employed in any other procedure requiring ultrapure water. All solvents and solutions used as the mobile phase for HPLC were vacuum-filtered using a solvent filtration system equipped with a \(0.45~\mu\)m Nylon membrane filter.
Instrumentation
Throughout this study, a Shimadzu HPLC system was employed, consisting of a quaternary solvent distribution pump (model LC-20AT), a variable wavelength ultraviolet detector (model SPD-20A), a column oven (model CTO-20A), a membrane degasser (model DGU-20A5), a system controller (model CBM-20A), and a manual injector with a \(20~\mu\)L loop for chromatographic analyses. The Lab Solution software was utilized to acquire analysis data and process chromatograms. An ACE Generix HPLC column with a C18 (octadecyl) stationary phase, \(4.6 \times 150\) mm dimensions, and a particle diameter of \(5~\mu\)m was used for chromatographic separations.
A Kasvi UV spectrometer, model K37-UVVIS, was employed to obtain the maximum absorption wavelength in the UV region for the sulfonamides of interest. A Shimadzu X-ray energy dispersive spectrometer, model EDX-7000, was operated for elemental analysis and chemical characterization of the sol-gel-coated fabric and uncoated fabric. A Jeol scanning electron microscope, model JSM-6610, Philips XL 30, equipped with Energy Dispersive Spectroscopy (EDS) Thermo Scientific NSS Spectral Imaging, was used to obtain Scanning Electron Microscopy (SEM) images of the coated and uncoated FPSE substrates. For sample preparation, a gold film deposition system, Desk V, Denton Vacuum LLC, equipped with a carbon accessory, was employed.
An inert atmosphere drying chamber, equipped with a continuous nitrogen gas flow and temperature control, adapted from a Tecnal drying and sterilization oven, model TE-393/1, was employed to prepare of the sol-gel-coated fabric. An analytical balance, Bioprecisa TDS Instrumental Tecnológica LTDA, model FA2104N, was used for weighing the various reagents. A Bel Engineering pH meter, model W3B, was manipulated to adjust the acetic acid solution’s pH as the HPLC mobile phase. A Quimis centrifuge, model Q222T216, was used for centrifugation to obtain particle-free sol-gel solutions.
A Unique ultrasonic bath, model Ultra Cleaner 1400, was employed for initial fabric cleaning and for obtaining bubble-free sol-gel solutions. A Global Equipamentos vortex mixer, model XH-CU, stirred and thoroughly mixed different solutions and samples. A Fisatom vacuum pump, model 825T, was used for vacuum filtration of solvents and solutions used as the mobile phase for HPLC. A Gehaka water deionizer system, model CG-200, was used to obtain deionized water for glassware cleaning and the pre-treatment stage of the cellulose fabric. A Milli-Q® Millipore Merk purification system was employed to obtain high-purity water used in solution preparation, sol-gel synthesis, and HPLC analyses.
Pre-treatment of fabric for sol-gel coating
Segments of cellulose fabric, each with an area of \(100~\text{cm}^2\), were initially rinsed with a large quantity of deionized water to ensure complete wetting. Subsequently, they were immersed in deionized water and subjected to sonication for \(15\) minutes to eliminate water-soluble particles and chemical residues from the industrial treatment of the fabric. The fabric was again washed with deionized water and underwent a mercerization process (alkaline treatment).
The fabric was immersed, with constant sonication, in a \(1~\text{mol.L}^{-1}\) sodium hydroxide solution for \(1\) hour. After this period, it was washed with deionized water until reaching a pH of \(7.0\). Next, it underwent immersion in a \(0.1~\text{mol.L}^{-1}\) hydrochloric acid solution, with constant sonication, for \(1\) hour. The fabric was then thoroughly washed with deionized water (to pH \(7.0\)) and finally dried at \(50\) ºC in an inert atmosphere drying chamber with continuous nitrogen gas flow for \(12\) hours. The dry fabric was stored in a clean, airtight glass container until coated with the sol-gel solution.
Preparation of sol-gel PEG solution
The sol-gel solution for fabric coating was prepared as described by Kumar, 2014, using a modified version of the formulation previously reported by Kabir, 2004. \(10\) g of the organic polymer PEG, \(10\) mL of the sol-gel precursor methyltrimethoxysilane (MTMS), \(20\) mL of a dichloromethane and acetone mixture (1:1, v/v) as the organic solvent system, and \(4\) mL of trifluoroacetic acid (containing \(5\) % water) as the sol-gel catalyst was dissolved.
After incorporating each new reagent into the sol-gel solution, the mixture was vortexed to ensure the formation of a homogeneous solution before adding the following reagent. After all additions, the mixture was vortexed for \(3\) minutes, centrifuged for \(5\) minutes, and sonicated for \(2\) minutes. The clear supernatant was transferred to a clean amber bottle.
Creation of the sol-gel coating on the fabric surface truque - azul
The pre-treated cellulose fabric served as the substrate for the sol-gel coating. The substrate was gently introduced into the reaction flask containing the sol-gel solution, forming a three-dimensional sol-gel network throughout the porous matrix of the substrate. The fabric remained in the flask for four hours. After the sol-gel PEG coating, the coated substrate was removed from the solution.
For solvent evaporation and aging of the sol-gel coating, the fabric was dried in a drying chamber adapted with continuous nitrogen gas flow, maintaining a temperature of \(50\) ºC for \(24\) hours. The coated fabric was then subjected to sonication for \(30\) minutes and immersed in a mixture of dichloromethane and acetone (1:1, v/v) to remove unreacted or non-bound residues from the coated surface. Subsequently, the coated cellulose substrate was dried at \(50\) ºC in an inert atmosphere with nitrogen flow for \(1\) hour.
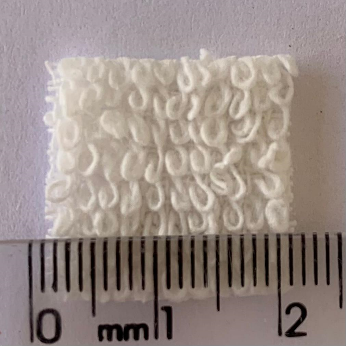
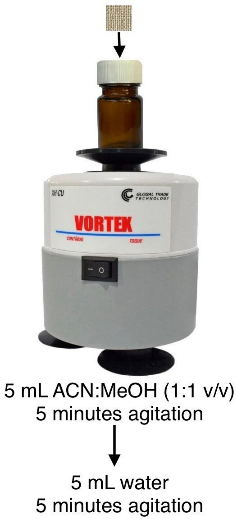
Finally, the fabric intended for the FPSE procedure was cut into pieces measuring \(2.0 \times 2.0\) cm (Figure 1 and stored in an airtight amber container to prevent contamination from accumulating unwanted analytes from the environment.
Characterization of uncoated and sol-gel-coated fabric truque - azul
The EDS analyses were performed using the EDX-7000 equipment. With this device, analyses of both uncoated and sol-gel PEG coated fabric were conducted. The equipment can detect elements with an atomic number greater than \(10\), covering the detectable range of elements from \(11\)Na to \(92\)U. This analysis was carried out to identify the presence of silicon in the fabric coated with the sol-gel PEG solution and its absence in the uncoated fabric. The analysis procedure involved directly inserting the fabric into the equipment’s sample holder to obtain EDS spectra.
SEM images of uncoated and sol-gel PEG-coated fabric samples were also acquired to compare and analyze their morphological characteristics before and after coating. Sample preparation for analysis involved fixing them on the equipment’s sample holder with double-sided carbon tape, and electrical contact was established with carbon paint. After drying, the samples were coated with a thin layer of gold using a gold film deposition system equipped with a carbon accessory. Subsequently, the samples were analyzed using SEM.
Wavelength selection
The optimal wavelength for quantifying sulfonamides under study in HPLC/UV was determined through UV spectroscopy analysis of individual solutions of SMZ and SMX, both at a concentration of \(2~\mu\text{g.mL}^{-1}\). A scan ranged from \(190\) nm to \(400\) nm to ascertain the wavelength of maximum absorbance in the UV region.
Mobile Phase Selection
The success of a chromatographic analysis depends, among other factors, on the choice of a suitable mobile phase. Various mobile phase compositions and different proportions of each composition were investigated to select the optimal mobile phase for the simultaneous detection of the target sulfonamides. These were applied in separating SMZ and SMX, both present simultaneously in a solution at a concentration of \(2~\mu\text{g.mL}^{-1}\) for each analyte. Table 1 describes all the tests conducted.
| Tested mobile phases | Proportions |
|---|---|
| ACN:H\(_2\)O | 60:40, 55:45, 45:55, 40:60, 35:65, 30:70, |
| 25:75 and 20:80. | |
| ACN:Acetate Buffer \(0.05~\text{mol.L}^{-1}\) pH 4.5 | 45:55, 40:60, 35:65 and 30:70. |
| ACN:Acetate Buffer \(0.05~\text{mol.L}^{-1}\) pH 3.0 | |
| ACN:Formic Acid \(0.1\) % (v/v) pH 3.0 | |
| MeOH:H\(_2\)O | 45:55, 40:60, 35:65, 30:70, 25:75 |
| and 15:85. | |
| MeOH:Acetate Buffer \(0.05~\text{mol.L}^{-1}\) pH 3.0 | 45:55, 40:60, 35:65 and 30:70. |
| MeOH:Formic Acid \(0.1\) % (v/v) pH 3.0 | |
| MeOH:ACN:H\(_2\)O | 30:10:60, 10:30:60, 25:10:65, 10:25:65, |
| 20:10:70, 10:20:70, 10:10:80 and 5:15:80. | |
| MeOH:ACN:Acetate Buffer \(0.05~\text{mol.L}^{-1}\) pH 3.0 | 30:10:60, 10:30:60, 25:10:65 and 10:25:65. |
| MeOH:ACN:Formic Acid \(0.1\) % (v/v) pH 3.0 |
FPSE procedure
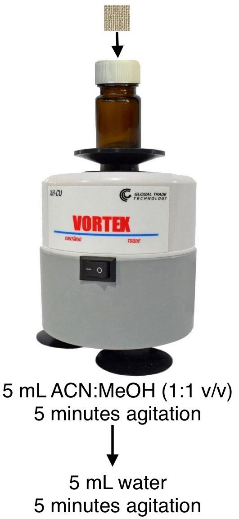
Before initiating the assay, the FPSE fabric was conditioned to clean any undesirable residues that might have settled on the material’s surface during storage. The conditioning involved immersing the adsorbent fabric in \(5\) mL of ACN and MeOH (1:1 v/v) mixture in an amber glass flask, under constant vortex agitation for \(5\) minutes. The organic solvent mixture quickly diffuses into the matrix of the porous and permeable substrate. Subsequently, the fabric was immersed in \(5\) mL of water in another amber glass flask vortexed for \(5\) minutes to remove residual organic solvents. The fabric was removed from the flask containing water for the next step.
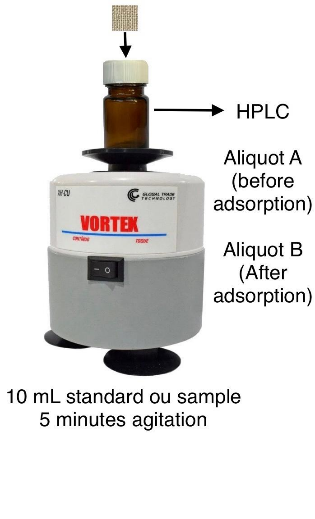
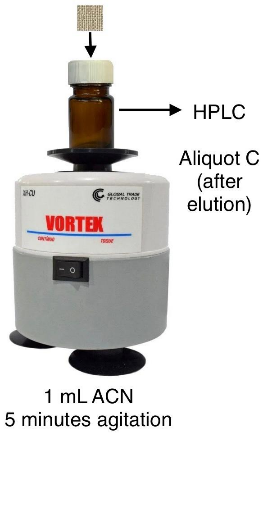
The adsorption procedure involved adding \(10\) mL of the standard solution or sample to an amber glass flask of \(25\) mL. In this step, the first aliquot for HPLC analysis was withdrawn, referred to as the solution before adsorption (aliquot A). Next, the clean FPSE substrate was carefully inserted into the extraction flask, and the solution was vortexed for \(5\) minutes. After this period, the fabric was removed from the flask. After adsorption, the second aliquot for analysis, referred to as the solution after adsorption (aliquot B), was withdrawn. Subsequently, the fabric was added to another amber glass flask containing \(1\) mL of ACN (elution solvent) and vortexed for \(5\) minutes. The eluting solvent containing the analytes, referred to as the solution after elution (aliquot C), was also subjected to HPLC analysis. All aliquots were filtered with a \(0.45~\mu\)m Nylon syringe filter before analysis.
Post-extraction cleaning is necessary for the adsorbent fabric to be reused. This step was performed by adding the fabric to \(5\) mL of a mixture of ACN and MeOH (1:1 v/v) in an amber glass flask, which was vortexed for \(5\) minutes. Subsequently, the fabric was immersed in \(5\) mL of water in another amber glass flask, which was vortexed for \(5\) minutes. Later, the substrate was removed from the flask, air-dried at room temperature, and stored in a hermetic amber glass flask for future use. The entire procedure used metal tweezers to handle the fabric, minimizing contamination by touch. Figure 2 illustrates a schematic representation of the FPSE procedure.
| (a) | (b) | (c) | (d) |
 |  |  |  |
To perform the FPSE assay, standard solutions or samples were used as follows: a mixture of SMZ and SMX standards at a concentration of \(0.1~\mu\text{g.mL}^{-1}\); milk enriched with analyte standards, also at a concentration of \(0.1~\mu\text{g.mL}^{-1}\); and milk without the addition of sulfonamides (non-enriched). The enriched milk sample was prepared by adding the required amount of SMZ and SMX standards to a volumetric flask and completing the volume with milk. The solution was left at rest for \(30\) minutes to allow for the complete interaction of sulfonamides with the milk. The FPSE procedure was conducted in triplicate (\(n=3\)) and is detailed in Table 2.
| Tissue | Standard or sample (\(\mathbf{n=3}\)) | Eluent | Aliquots analyzed by HPLC | ||
|---|---|---|---|---|---|
| sol-gel PEG | Standard solution | ACN | A | B | C1 |
| Enriched milk | NR | NR | C2 | ||
| Non-enriched milk | NR | NR | C3 | ||
A - before adsorption; B - after adsorption; C - after elution; NR - not performed.
Note. The standard solution and enriched milk contained \(0.1~\mu\text{g.mL}^{-1}\) of SMZ and SMX.
Results and Discussion
X-ray energy dispersive spectroscopy
Figure 3 presents the results of the EDS analyses of the fabric coated with sol-gel PEG solution and the uncoated fabric.
Most of the chemical composition of 100 % cotton fabric is cellulose, accounting for approximately 98 %. The cellulose molecule consists solely of carbon, oxygen, and hydrogen; however, these elements are not detectable in the EDS analysis. Therefore, the uncoated cotton fabric should not exhibit peaks in the spectrum. In contrast, fabric coated with sol-gel PEG solution is expected to display a peak associated with the silicon element, originating from the MTMS molecule, a precursor reagent for sol-gel.
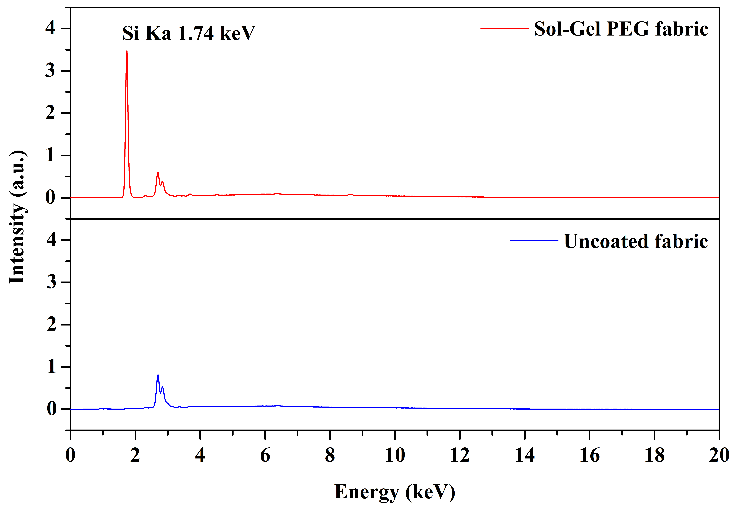
This analysis served as a means for the preliminary characterization of the sol-gel-coated fabric, allowing for a quick and qualitative assessment of the success of the sol-gel coating procedure. As anticipated, upon examining the spectra in Figure 3, the presence of the characteristic silicon peak in the fabric coated with the sol-gel solution (at \(1.74\) keV) is evident. At the same time, its absence is confirmed in the uncoated fabric. These results confirm the effectiveness of the surface coating procedure on the FPSE substrates with the sol-gel solution. The peaks at \(2.69\) keV and \(2.83\) keV in both the coated and uncoated fabric spectra originate from the background signal from the X-ray tube.
Scanning electron microscopy
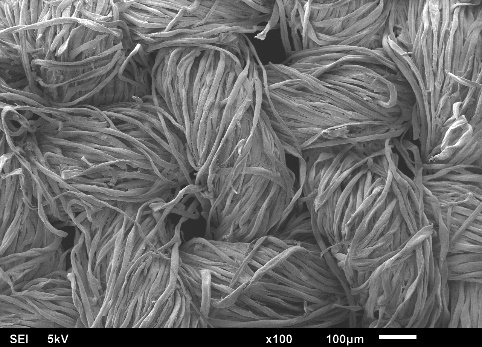
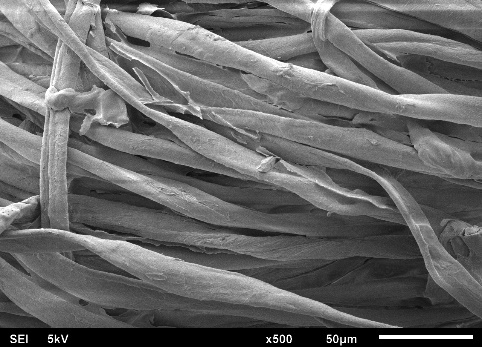
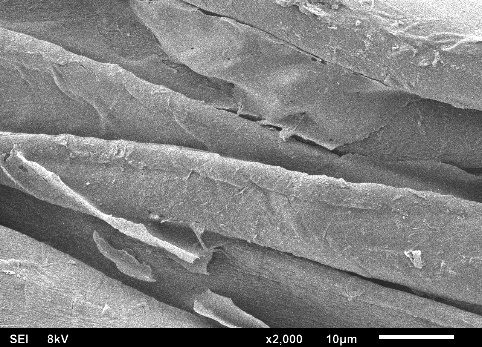
Figures 4(a) to 4(f) illustrate the SEM images obtained in this study, depicting the fabric coated with sol-gel PEG and the uncoated fabric. This SEM characterization analysis was conducted to compare the surface morphology of the fabrics before and after the coating process.
| (a) | (b) | (c) |
 |  |  |
| (d) | (e) | (f) |
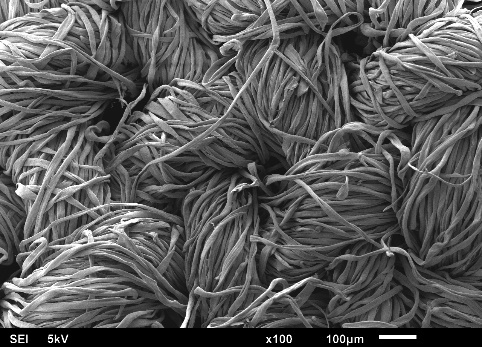 | 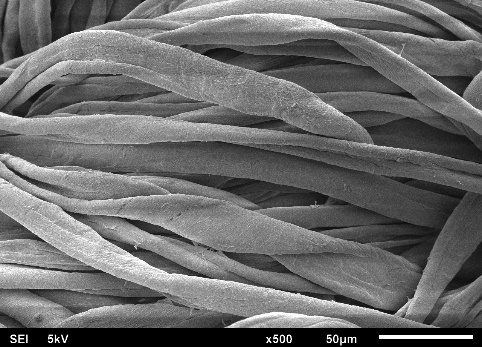 | 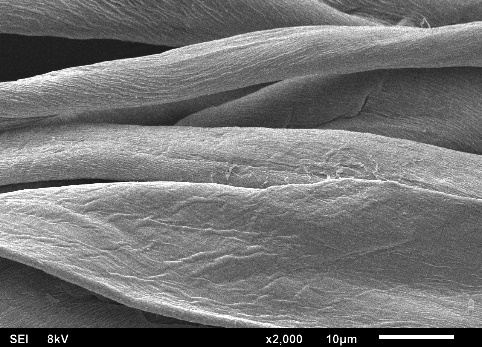 |
In the SEM images, it can be observed that each fiber of the cellulose fabric is composed of numerous microfibers, and the presence of pores symmetrically projected on the fabric’s surface, originating from the industrial weaving process, is evident. When comparing the images of the coated fabrics with those of the uncoated fabric, it is noticeable that the microfibers and the pores remain intact after coating with the sol-gel solution.
The sol-gel solution has low viscosity, facilitating access to the FPSE substrate matrix. This fact allows the formation of an ultra-thin and uniform sol-gel coating film across the entire fabric surface. Due to the formation of this ultra-thin and evenly distributed film on the cellulose substrate, the presence of the sol-gel coating is barely visible, making it difficult to distinguish between coated and uncoated cellulose microfibers.
SEM images revealed that the sol-gel coating was not limited solely to the adsorbent’s surface but occurred as a thin film enveloping the microfibers throughout the three-dimensional matrix of the substrate. This process did not obstruct the fabric pores, a crucial characteristic that enables easy permeation of the sample across the entire adsorbent length. Consequently, sorption extraction can be achieved more efficiently, exhibiting a high analyte retention capacity in a shorter period.
Wavelength selection
Figure 5 presents the UV absorption spectra, highlighting the wavelengths of maximum absorbance obtained for the studied sulfonamides. The observed maximum absorptions were \(269\) nm for SMZ and \(267\) nm for SMX. This absorbance range was expected due to the presence of aromatic chromophores in the structures of sulfonamides, which exhibit characteristic maximum absorption above \(200\) nm. The observed wavelength variation between the two molecules is related to the structural increments represented by their different substituents (Oliveira, 2012).
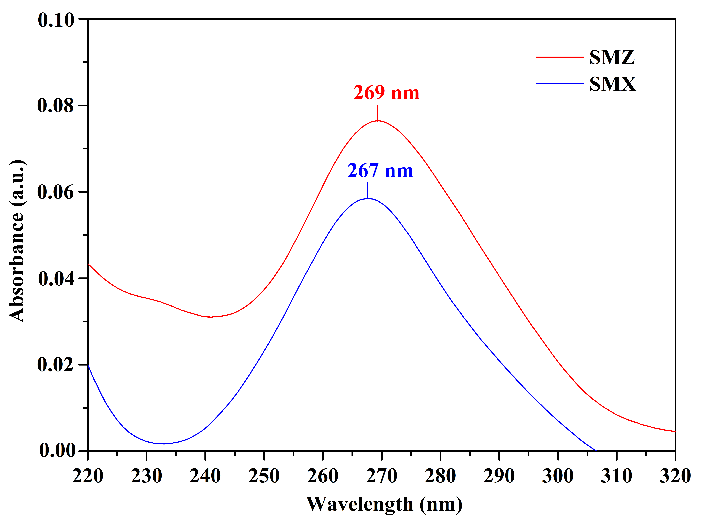
The studied compounds exhibited very closely situated maximum absorption wavelengths, suggesting that differences in chromatographic analysis results using either one will not be significant. The HPLC/UV equipment employed in this study enables the consecutive selection of up to two different wavelengths for chromatographic analyses. Therefore, the decision was made to utilize both maximum absorption wavelengths of the analytes during the mobile phase selection step, allowing for the assessment of optimal results concerning the chosen mobile phase.
Mobile Phase Selection
An isocratic elution mode was chosen for tests to determine the optimal mobile phase. The various mobile phases were delivered at a flow rate of \(1.0~\text{mL.min}^{-1}\), with an injection volume of \(20~\mu\)L. The analysis wavelengths employed were \(269\) nm and \(267\) nm, and the column was operated at \(28\) ºC. The total chromatographic runtime was \(6\) minutes.
According to a literature review, numerous studies analyzing sulfonamides in milk by HPLC (Manzanares et al., 2014; Armentano et al., 2018; Duan et al., 2020; Feng et al., 2019; Karageorgou et al., 2016; Kechagia et al., 2017; Li et al., 2015; Liao et al., 2021; Maggira et al., 2019; Nebot et al., 2013; Qi et al., 2018; Tolika et al., 2011; Wang et al., 2016; Wu et al., 2007; Zhang et al., 2019) utilize various compositions and distinct proportions of ACN, MeOH, and an acidic solution or buffer, including acetic or formic acid, as the mobile phase.
Thus, the selection of the composition of the mobile phases tested in this study prioritized the use of ACN, MeOH, acetic acid, and formic acid. Tests were also conducted by substituting acids with water since using a buffer solution requires additional care, both with the chromatographic column and the HPLC system. Additional care is necessary because the precipitation of salts in the solutions may occur if buffer elimination before system shutdown is not carried out correctly and effectively, significantly reducing the lifespan of both components (Maldaner, 2010).
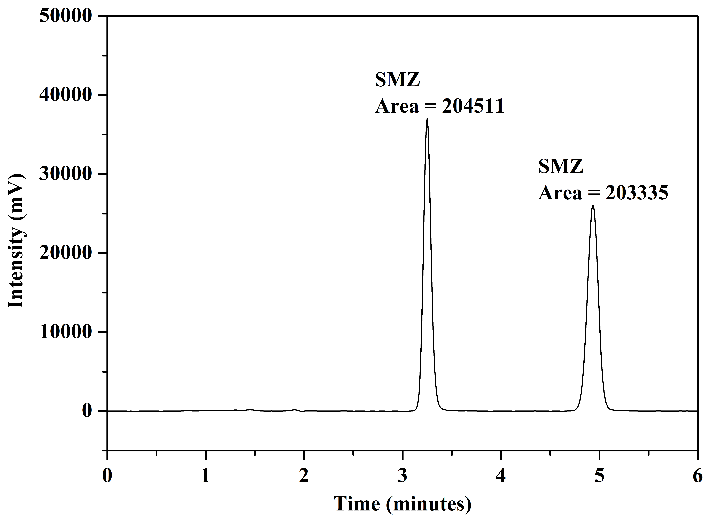
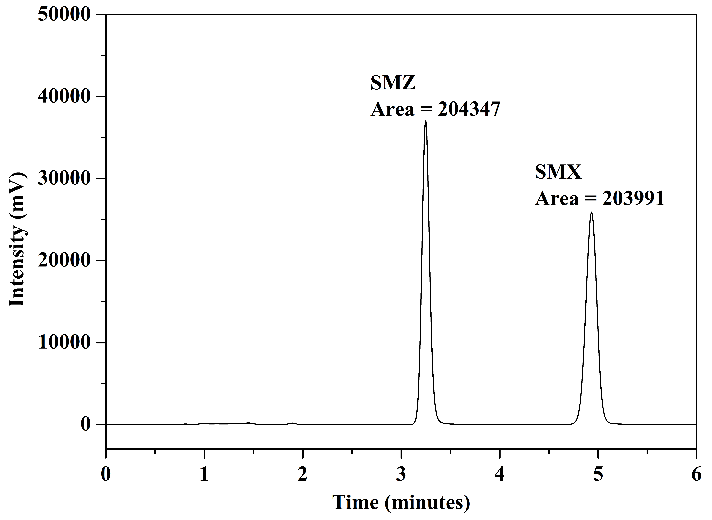
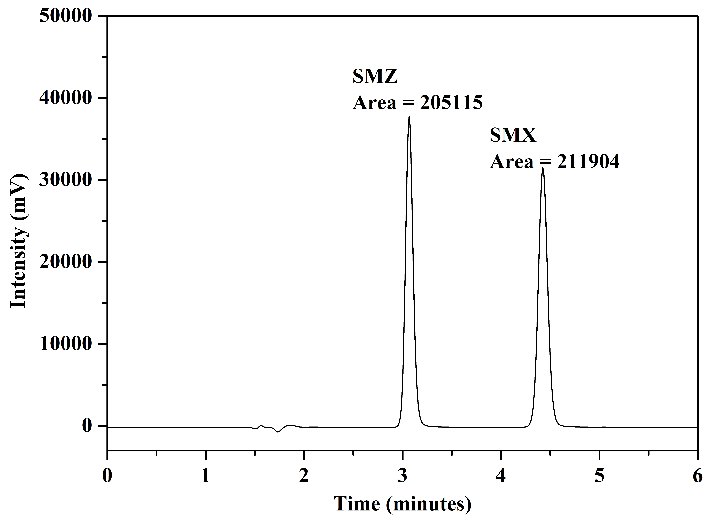
The optimal results obtained in tests using different mobile phases for the simultaneous detection of SMZ and SMX are presented in Figure 6. These were achieved through the use of two distinct mobile phases: mobile phase 1, composed of ACN and H\(_2\)O (30:70 v/v), as shown in Figure 6(a) for the wavelength of \(269\) nm and in Figure 6(b) for \(267\) nm; and mobile phase 2, composed of MeOH, ACN, and \(0.05~\text{mol.L}^{-1}\) acetate buffer pH 3.0 (10:25:65 v/v/v), as depicted in Figure 6(c) for the wavelength of \(269\) nm and in Figure 6(d) for \(267\) nm. Upon analyzing the chromatograms, it is observed that these two mobile phases provided good analytical separation of the studied compounds. There was no a significant variation in the areas of the chromatographic peaks concerning the wavelength used. Therefore, the decision was made to utilize the wavelength of \(267\) nm to represent the chromatograms in the FPSE procedure.
As indicated in Figures 6(a) to 6(d), although the differences in chromatographic areas were not highly significant, they were slightly larger when mobile phase 2 was employed. The milk sample matrix is highly complex and contains numerous interferents. Consequently, peak overlap from matrix substances with analyte peaks is possible, complicating quantification. Given this complexity and the need for greater sensitivity, good baseline separation with narrow peak shapes, improved resolution, and minimization of interferences in analyte retention times, it was decided to test these two mobile phases in the next stage of the study (FPSE procedure) to evaluate the best results concerning sample matrix.
| (a) | (b) |
 |  |
| (c) | (d) |
 |  |
FPSE procedure
The extraction of sulfonamides was carried out using an adapted version of the FPSE developed by Kabir & Furton, 2014. This extraction technique combines the advantages of sol-gel-derived adsorbents described by 2013 with the rich surface chemistry of cellulose fabric, resulting in an efficient adsorbent substrate. The assay was conducted to evaluate the performance of the FPSE procedure using cotton fabric coated with a sol-gel PEG solution for the simultaneous extraction of analytes in the solution of SMZ and SMX standards (\(0.1~\mu\text{g.mL}^{-1}\)) in milk enriched with the same standards (\(0.1~\mu\text{g.mL}^{-1}\)) and in non-enriched milk.
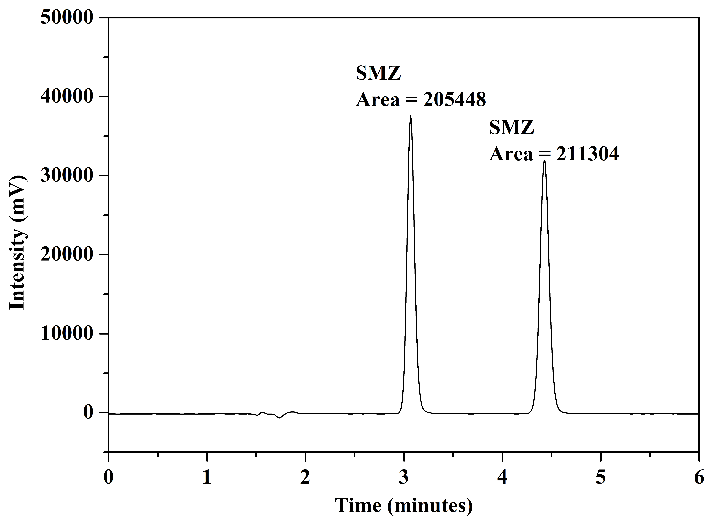
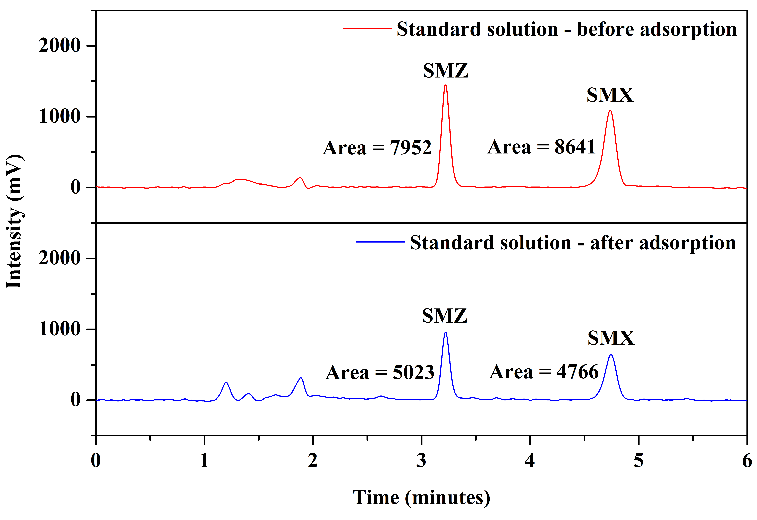
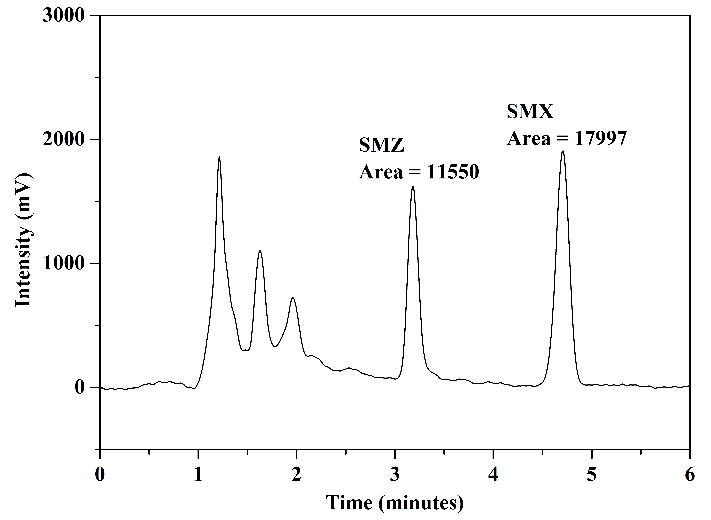
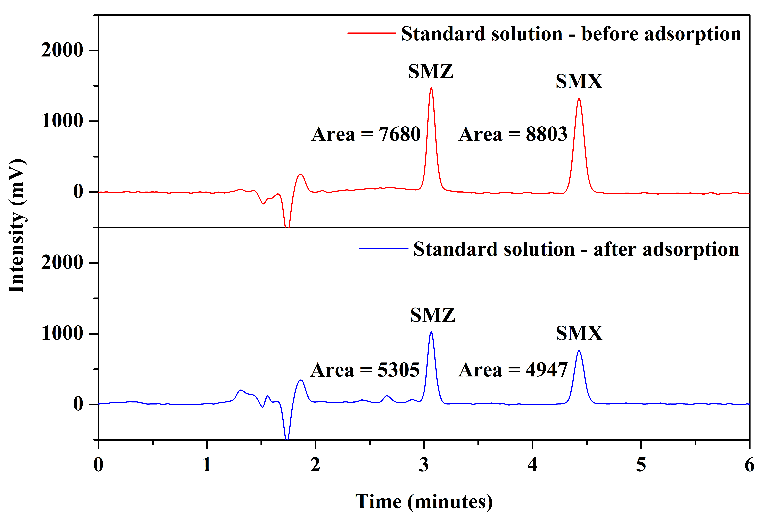
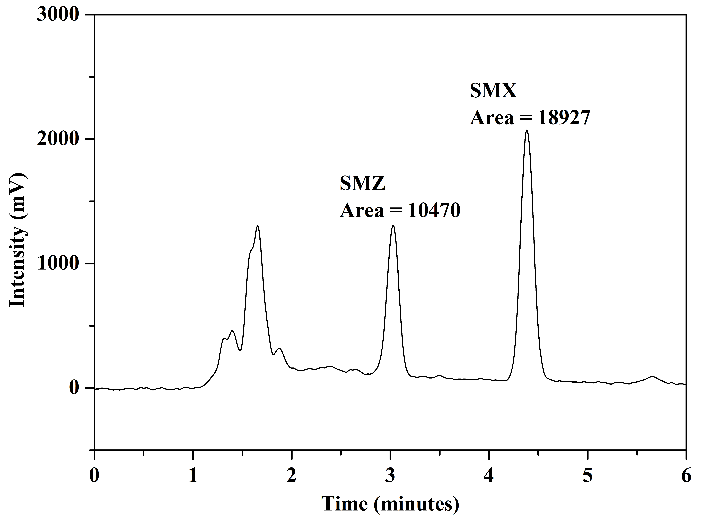
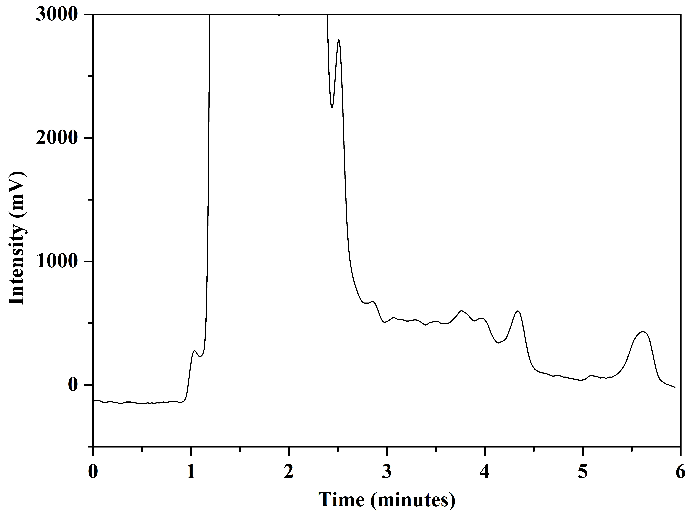
The chromatograms obtained from the analysis of the standard solution are presented in Figure 7: Figure 7(a) presents the analysis of aliquots A and B (before and after the adsorption procedure) using mobile phase 1; Figure 7(b) shows the result of the analysis of aliquot C (after elution) using mobile phase 1; Figure 7(c) presents the chromatograms of the analysis of aliquots A and B using mobile phase 2; and finally, Figure 7(d) displays the chromatogram obtained in the analysis of aliquot C using mobile phase 2.
In the chromatograms of the analyses conducted with aliquots before and after adsorption, Figures 7(a) and 7(c), for both mobile phases utilized, a reduction in chromatographic areas was observed for both studied sulfonamides, confirming the occurrence of the adsorption process as expected. In the chromatograms obtained from the analyses of aliquots after elution, Figures 7(b) and 7(d), it was noted that interferents related to the FPSE process and elution solvent did not co-elute with the peaks of SMZ and SMX. Additionally, these peaks exhibited good resolution and selectivity for both mobile phases. No significant differences were observed comparing the chromatographic areas obtained using the two tested mobile phases.
| (a) | (b) |
 |  |
| (c) | (d) |
 |  |
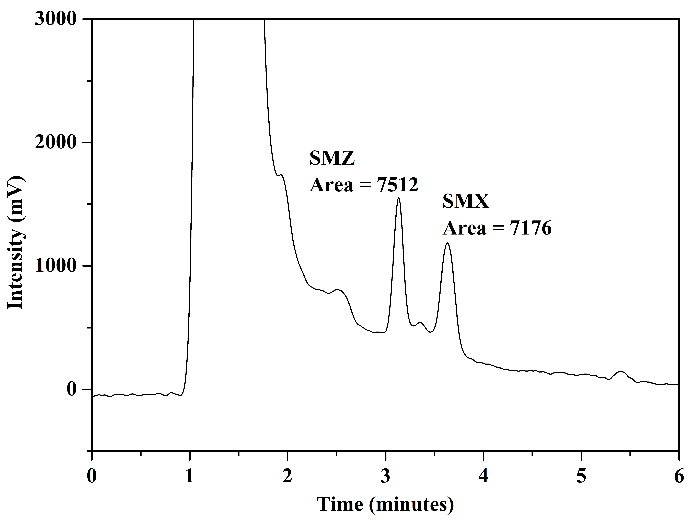
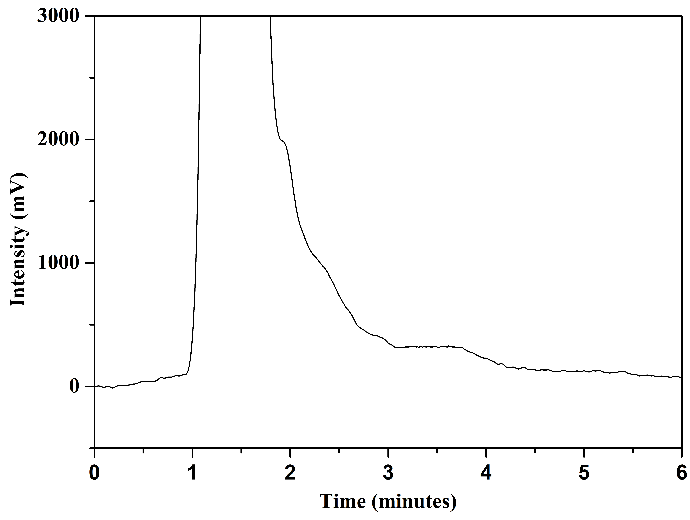
Tests were conducted using mobile phase 1 and mobile phase 2 to assess how HPLC analysis results would behave concerning the matrix of milk samples. Figure 8 illustrates the chromatograms obtained through the analysis of aliquot C (after elution) from milk samples enriched with the standards of the analytes under study and non-enriched milk: mobile phase 1, Figures 8(a) and 8(b), and mobile phase 2, Figures 8(c) and 8(d).
| (a) | (b) |
 |  |
| (c) | (d) |
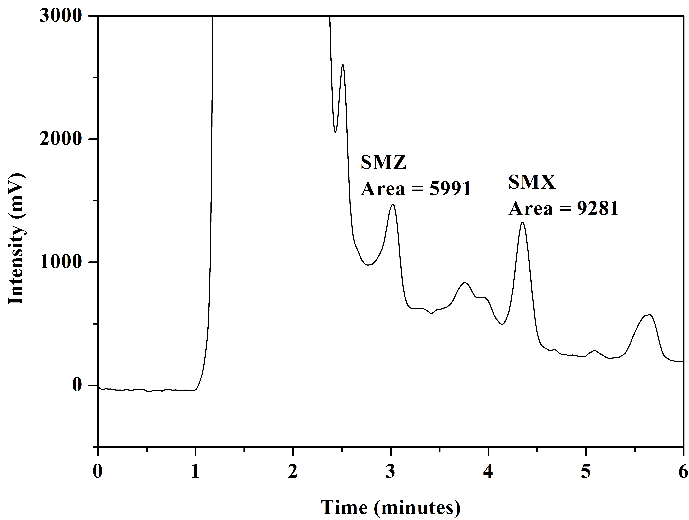 |  |
In the chromatogram of the enriched milk sample obtained using mobile phase 1, Figure 8(a), good resolution and selectivity were observed, with no overlap of standard peaks with interfering peaks. The chromatogram of the non-enriched milk sample, Figure 8(b), confirmed this, which showed no interferences at the same retention time as the studied sulfonamides. However, in analyzing the enriched milk sample obtained using mobile phase 2, Figure 8(c), more baseline separation of analyte peaks was needed, potentially complicating quantification. The chromatogram of the non-enriched milk, Figure 8(d), revealed the presence of interfering peaks in the elution range of the analytes, causing overlap in the analysis of the enriched milk.
Thus, despite mobile phase 2 presenting slightly larger chromatographic areas in the analysis of SMZ and SMX standards (\(2~\mu\text{g.mL}^{-1}\)) in the mobile phase selection step, mobile phase 1 was selected as the more favorable and selective one for the complex milk matrix. Another advantage of using mobile phase 1 is its absence of buffer solution, which requires more careful handling regarding the cleaning of the chromatographic column and HPLC system.
The evaluation of analyte removal capacity using the FPSE device was conducted through the averages of chromatographic areas of \(0.1~\mu\text{g.mL}^{-1}\) SMZ and SMX standard solution obtained by triplicate analyses (\(n=3\)) of aliquots before adsorption (initial area) and after adsorption (post-extraction area) in assays using mobile phase 1, as presented in Figure 7(a). The percentage removal (% removal) of analytes achieved with the FPSE adsorbent was calculated according to equation (1)
\[ \%~\text{removal} = \frac{A_\text{initial} - A_\text{post\_extraction}}{A_\text{initial}} \times 100,\]
where,
\(A_\text{initial} =\) chromatographic area of the aliquot before adsorption in the standard solution;
\(A_\text{post\_extraction} =\) chromatographic area of the aliquot after adsorption in the standard solution.
Table 3 presents the results of the average % removal obtained by the FPSE procedure for the \(0.1~\mu\text{g.mL}^{-1}\) standards analyzed in triplicate (\(n=3\)).
| Analytes | % removal average (\(n=3\)) |
|---|---|
| SMZ | \(35.30~\% \pm 1.09\) |
| SMX | \(42.79~\% \pm 1.68\) |
The FPSE procedure demonstrated a removal of 35.30 % for SMZ and 42.79 % for SMX, indicating that the adsorbent system used is efficient for the simultaneous extraction of the studied sulfonamides in UHT milk without the need for sample pre-treatment or protein precipitation.
Conclusion
Through the EDS spectroscopic analysis, conducted to characterize the sol-gel-coated fabric and the uncoated fabric preliminarily, it was observed, in the coated fabric, the presence of characteristic peaks of silicon from the sol-gel precursor reagent, indicating that the coating process was successful. The SEM analysis confirmed this result. In the images obtained in this assay, the formation of an ultra-thin sol-gel coating film was observed, uniformly distributed over the entire surface of the fabric without causing blockage of the pores resulting from the industrial weaving process. This characteristic is crucial to enable the permeability and diffusion of analytes through the utilized fabric.
The wavelength of \(267\) nm, selected for use in HPLC/UV analyses, proved effective for both studied sulfonamides. Regarding the mobile phase, the two compositions chosen for evaluation in the FPSE procedure showed good analytical separation of the analytes. However, upon introducing the complex matrix of milk, it was found that the optimal mobile phase composition for the extraction of sulfonamides consisted of ACN and H\(_2\)O (30:70 v/v). This composition proved to be the most selective for the studied compounds, with no interfering peaks in the elution range of analytes, allowing for efficient detection by HPLC/UV. The assessment of analyte removal capacity revealed that the FPSE system was adequate for the simultaneous extraction of SMZ and SMX in UHT milk.
Author contributions
G.M.M. De Filippis participated in conceptualization, data curation, formal analysis, investigation, methodology, visualization, and writing - original draft. L.M. Coelho participated in conceptualization, supervision, validation, writing - revision and editing. E.I. Melo participated in supervision, validation, writing - revision and editing.
Conflicts of interest
The authors certify that no commercial or associative interest in the manuscript represents a conflict of interest.
Acknowledgments
The authors acknowledge the doctoral fellowship of Fundação de Amparo à Pesquisa do Estado de Goiás (FAPEG), which was awarded under Public Call No. 003/2018.
References
Anthemidis, A., Kazantzi, V., Samanidou, V., Kabir, A. & Furton, K. G. An automated flow injection system for metal determination by flame atomic absorption spectrometry involving on-line fabric disk sorptive extraction technique. 64--70. https://doi.org/10.1016/j.talanta.2016.05.012
Armentano, A., Summa, S., Magro, S. L., Palermo, C., Nardiello, D., Centonze, D. & Muscarella, M. Rapid method for the quantification of 13 sulphonamides in milk by conventional high-performance liquid chromatography with diode array ultraviolet detection using a column packed with core-shell particles. 46--52. https://doi.org/10.1016/j.chroma.2017.11.015
Manzanares, N. A., Gracia, L. G. & Campaña, A. M. G. (2014). Alternative sample treatments for the determination of sulfonamides in milk by {HPLC. Elsevier. 459-464. https://doi.org/10.1016/j.foodchem.2013.08.008
Dost, K., Jones, D. C. & Davidson, G. Determination of sulfonamides by packed column supercritical fluid chromatography with atmospheric pressure chemical ionisation mass spectrometric detection. 1243--1247. https://doi.org/10.1039/B002823L
Duan, X., Liu, X., Dong, Y., Yang, J., Zhang, J., He, S., Yang, F., Wang, Z. & Dong, Y. A green {HPLC. 1181--1189. https://doi.org/10.1093/jaoacint/qsaa006
Feng, Y., Hu, X., Zhao, F. & Zeng, B. Fe3O4/reduced graphene oxide-carbon nanotubes composite for the magnetic solid-phase extraction and {HPLC. 1058--1066. https://doi.org/10.1002/jssc.201801177
Kabir, A. & Furton, K. G. (2014). Fabric Phase Sorptive Extractors ({FPSE.
Kabir, A., Furton, K. G. & Malik, A. Innovations in sol-gel microextraction phases for solvent-free sample preparation in analytical chemistry. 197--218. https://doi.org/10.1016/j.trac.2012.11.014
Kabir, A., Hamlet, C. & Malik, A. Parts per quadrillion level ultra-trace determination of polar and nonpolar compounds via solvent-free capillary microextraction on surface-bonded sol-gel polytetrahydrofuran coating and gas chromatography--flame ionization detection. 1--13. https://doi.org/10.1016/j.chroma.2004.06.078
Karageorgou, E., Manousi, N., Samanidou, V., Kabir, A. & Furton, K. G. Fabric phase sorptive extraction for the fast isolation of sulfonamides residues from raw milk followed by high performance liquid chromatography with ultraviolet detection. 428--436. https://doi.org/10.1016/j.foodchem.2015.09.060
Kechagia, M., Samanidou, V., Kabir, A. & Furton, K. G. P41: {HPLC.
Khaniki, G. R. J. Chemical contaminants in milk and public health concerns: a review. 104--115. https://doi.org/10.3923/ijds.2007.104.115
Kumar, R., Gaurav, Heena, Malik, A. K., Kabir, A. & Furton, K. G. Efficient analysis of selected estrogens using fabric phase sorptive extraction and high performance liquid chromatography-fluorescence detection. 16--25. https://doi.org/10.1016/j.chroma.2014.07.013
Liao, W., Ning, Y., Zhang, Y., Wang, W. & Wang, A. Determination of sulfonamides in milk and egg samples by {HPLC. 4402--4411. https://doi.org/10.1002/jssc.20210059
Li, Y., Wu, X., Li, Z., Zhong, S., Wang, W., Wang, A. & Chen, J. Fabrication of {CoFe2O4. 1279--1286. https://doi.org/10.1016/j.talanta.2015.08.006
Maggira, M., Deliyanni, E. A. & Samanidou, V. F. Synthesis of graphene oxide based sponges and their study as sorbents for sample preparation of cow milk prior to {HPLC. 2086. https://doi.org/10.3390/molecules24112086
Maldaner, L., Collins, C. H. & Jardim, I. C. S. F. Fases estacionárias modernas para cromatografia lÃquida de alta eficiência em fase reversa. 1559--1568. https://doi.org/10.1590/S0100-40422010000700024
Ministry of Agriculture & Livestock (2022). Mapa do leite: polÃticas públicas e privadas para o leite.
Nebot, C., Regal, P., Miranda, J. M., Fente, C. & Cepeda, A. Rapid method for quantification of nine sulfonamides in bovine milk using HPLC/MS/MS and without using SPE. 2294--2299. https://doi.org/10.1016/j.foodchem.2013.04.099
Oliveira, T. M. A. Otimização de validação de método analÃtico para preparo da amostra e determinação simultânea de sulfonamidas em mel.
Qi, M., Tu, C., Li, Z., Wang, W., Chen, J. & Wang, A. J. Determination of sulfonamide residues in honey and milk by {HPLC. 2885--2896. https://doi.org/10.1007/s12161-018-1271-5
Roldán-Pijuán, M., Lucena, R., Cárdenas, S., Valcárcel, M., Kabir, A. & Furton, K. G. Stir fabric phase sorptive extraction for the determination of triazine herbicides in environmental waters by liquid chromatography. 35--45. https://doi.org/10.1016/j.chroma.2014.12.027
Samanidou, V., Galanopoulos, L. D., Kabir, A. & Furton, K. G. Fast extraction of amphenicols residues from raw milk using novel fabric phase sorptive extraction followed by high-performance liquid chromatography-diode array detection. 41--50. https://doi.org/10.1016/j.aca.2014.11.036
Santos, J. R. M. P. Desenvolvimento de metodologias para a determinação de resÃduos de sulfonamidas em leite.
Silva, D. B. C. Uso de antimicrobianos em propriedades leiteiras do estado de Goiás.
Tolika, E. P., Samanidou, V. F. & Papadoyannis, I. N. Development and validation of an HPLC method for the determination of tem sulfonamide residues in milk according to 2002/657/EC. 1627--1635. https://doi.org/10.1002/jssc.201100171
Trombete, F. M., Santos, R. R. & Souza, A. L. R. Residuos de antibióticos en la leche comercializada en Brasil: una revisión de los estudios publicados en los últimos años. 191--197. https://doi.org/10.4067/S0717-75182014000200010
Wang, Y., Liu, L., Xiao, C., Chen, L., Yang, P., Liu, Q., Wang, J. & Liu, X. Rapid determination of trace sulfonamides in milk by graphene oxide-based magnetic solid phase extraction coupled with HPLC/MS-MS. 2521--2530. https://doi.org/10.1007/s12161-016-0433-6
Wu, Y. L., Li, C., Liu, Y. J. & Shen, J. Z. Validation method for the determination of sulfonamide residues in bovine milk by HPLC. 191--195. https://doi.org/10.1365/s10337-007-0279-6
Zhang, J., Li, W., Zhu, W., Yang, Y., Qin, P., Zhou, Q., Lu, M. & Cai, Z. Mesoporous graphitic carbon nitride as an efficient sorbent for extraction of sulfonamides prior to HPLC analysis. 1--9. https://doi.org/10.1007/s00604-019-3394-9
Brazilian Health Regulatory Agency. (2019). Normative Instruction No. 51, dated December 19, 2019. Disponível em: https://www.in.gov.br/en/web/dou/-/instrucao-normativa-n-51-de-19-de-dezembro-de-2019-235414514
Ministry of Agriculture and Livestock. (2022). Mapa do leite: políticas públicas e privadas para o leite. Disponível em: https://www.gov.br/agricultura/pt-br/assuntos/producao-animal/portal-do-leite/mapa-do-leite/