
Clustering Techniques and Innovation-based Comparison in Londrina and Region Companies

DOI 10.5433/1679-0375.2024.v45.49522
Citation Semin., Ciênc. Exatas Tecnol. 2024, v. 45: e49522
Received: 6 December 2023; Received in revised for: 2 April 2024; Accepted: : 8 April 2024; Available online: 6 May 2024.
Abstract:
Innovation is often considered a cornerstone for success across various companies. However, research focused on measuring and describing innovation frequently relies on classical statistical techniques. In this context, this study applied unsupervised machine learning techniques to cluster companies in the Londrina region, investigating how variables related to innovation differ among the identified clusters. Data were collected through a survey instrument adapted from CIS 4 and PINTEC, encompassing 26 responding companies, although 23 were analyzed in this study. Four clustering algorithms were employed: k-means, k-means+PCA, hierarchical, and hierarchical+PCA. Regarding the results, the hierarchical+PCA algorithm showed improved separation between service and manufacturing companies. Clusters identified with the value “1” indicated concerns related to regular investment in R&D, collaborations for innovation, and requests/registrations of patents in the last three years. Analyzing demographic characteristics revealed that clusters identified by hierarchical+PCA exhibited a higher presence of service sector companies, while cluster 1 showed a prevalence of industries, suggesting that these possess more innovative characteristics in the Londrina region. space-0.15cm
Keywords: innovation, clustering, k-means, hierarchical clustering, principal component analysis
Introduction
Innovation is often seen as the cornerstone for success in many areas, such as businesses and even countries (Robinson & Stubberud, 2012). Moreover, Claudino et al., 2017 state that innovation is considered an important instrument for companies to increase their competitiveness and stay strong in scenarios of constant market changes and variations. It enables this increase in competitiveness by allowing the company to develop new capabilities and resources (Barney, 2010).
Innovation is the introduction of a new or significantly improved product (good or service), a new process, a new marketing method, or a new organizational method within the company’s structure, workplace, or the market in which it operates (Organization for Economic Co-operation & Developmen [OECD], 2018).
According to a survey with executives from 500 medium and large industries, conducted by CNI (National Confederation of Industry) and applied by the FSB Research Institute in October 2021, 80 % of the sample of companies innovated during the pandemic and experienced increased profits, productivity, and market competitiveness (Confederação, 2021). This information corroborates the affirmation by de Carvalho et al. (, p. 11), which states, ‘usually, the more innovative a company is, the greater its competitiveness and better its position in the market in which it operates.’. In the same vein, Akman et al., 2023 cite that it is important for business that companies engage in innovation activities, not only for the company but for the overall economic development of a country.
According to OECD () there are four types of innovation: product, process, marketing, and organizational. Based on the definitions described in the manual, Eurostat created the Fourth Community Innovation Survey (CIS 4), a questionnaire to assess companies’ innovative capacity. However, merely obtaining this data is not sufficient to identify distinct groups of companies; it is necessary to know how to extract useful and valuable information and knowledge from these data sets that can serve as a foundation for decision-making or an assertive description of a sample or population.
With the advancement of frontier technologies such as 5G, Artificial Intelligence, Internet of Things, blockchain, cloud computing, big data, among others, they have contributed to the phenomenon of the smart economy, driven by intelligent innovation, which is a process of creating value by strengthening multiple aspects of society (Ma et al., 2023).
For knowledge extraction, data mining (DM) is used, which is one of the most important stages in the process of discovering knowledge in databases (Knowledge Discovery in Databases – KDD) (Galvão & Marin, 2009).
KDD seeks hidden patterns in a large volume of information using some specific methodology, which is useful for various applications (Alam et al., 2014). Thus, they can be used in various areas such as agribusiness, genetic improvement, and stock markets, among others. The only requirement for applying KDD is that there be manipulable data (Fayyad et al., 1996), and that the innovation area can generate data on the level of maturity of companies with great potential for exploration. Data mining techniques may include machine learning algorithms in managing innovation in various fields, especially in economic research and predicting technological evolution (Akman et al., 2023).
Data clustering is a category of unsupervised learning techniques because it uses unlabeled data to recognize patterns (Zengin et al., 2011), allowing the discovery of hidden structures in data where the correct answer is not known beforehand. The goal of this technique is to find patterns and form natural data clusters so that items in the same group are similar to each other than those in different groups (Raschka, 2015).
Considering the importance of innovation and the difficulty in measuring it, this study used the CIS 4 questionnaire and the PINTEC (Industrial Research of Technological Innovation) for the creation and application of a data collection instrument in companies in Londrina and the surrounding region. These data were grouped using unsupervised machine learning techniques and analyzed visually, always highlighting the most relevant variables in the clusters found.
After this introductory section, the rest of the article is divided into four more sections. The second section discusses the methods of data collection and analysis, as well as the clustering techniques applied. Section three addresses the results found for the groups identified by the algorithms, providing their description. Section four discusses the impacts of the results concerning what is already known in the literature. Finally, section five describes what was researched, indicating the limitations of the work and possible directions for future research.
Related works
The articles directly applied to aspects related to innovation are scarce, especially concerning clustering tasks. The articles that come closest to this present research are summarized below.
The study by Ma et al., 2023 explored national intelligence innovation through machine learning techniques, introducing the Global Intelligence Innovation Index (GIII) as an evaluation measure. Their conceptual framework included machine learning methods, such as k-means clustering and random forest are employed for measurement. Their findings reveal complex relationships between intelligence innovation, economic factors, and unemployment.
Akman et al., 2023 presented a method for assessing innovation capabilities in companies using unsupervised and supervised machine learning algorithms. Their research categorizes companies into different groups based on their innovation capabilities, and they employ a range of classification algorithms, including KNN, GaussianNB, RandomForest, and others. The study achieves high accuracy in assessing innovation capabilities, with LightGBMC and SVMC showing superior performance.
The research by Zaini et al., 2022 focused on the retrieval and analysis of patent documents. They employ machine learning algorithms, including principal components analysis (PCA) and k-means clustering, to extract insights from patent data, particularly within the domain of anti-corrosion technologies.
In the same area, Rhoden et al., 2022 proposed a functional data approach for regional innovation clustering, utilizing patent registration data and other economic indicators across European regions. Their method categorizes regions based on their innovation portfolios, considering patterns of specialization among innovation types. This research introduces technology specificity as a new criterion for regional innovation policy, offering insights into tailored and efficient innovation support.
Zhou & Luo, 2023 examined technology merger and acquisition (M&A) and its impact on innovation performance. Employing ensemble learning approaches in machine learning, they compare the predictive power of various factors on technology M&A innovation performance. Their findings identify the motivation of the acquirer as a significant factor and highlight AdaBoost as a powerful prediction method.
Liu et al., 2020, investigated the main determinants of perceived strength of intellectual property rights (IPR) in developed and emerging Asian countries. The authors employed Cluster-Lasso approach in panel models with additive unobserved individual-specific heterogeneity, revealing a range of significant factors influencing IPR, including bribery and corruption, government policy adaptability, and education. These findings have implications for policymakers aiming to enhance IP protection and encourage innovation.
Huang et al., 2020 delved into the evolution of innovation ecosystems in high-tech zones, specifically focusing on the Nanning National High-tech Zone in China. Employing data mining technology, they establish an index variable system to quantify innovation input, output, and environment. Their empirical analysis sheds light on the relationship between these factors and the overall innovation of high-tech zones.
These articles demonstrate the possibilities of applying machine learning techniques in the context of innovation. However, no found work applied clustering techniques to data concerning general characteristics of innovation, particularly related to the CIS 4 questionnaire.
Materials and Methods
Figure 1 summarizes the steps undertaken in this research, from data collection to the application of algorithms.
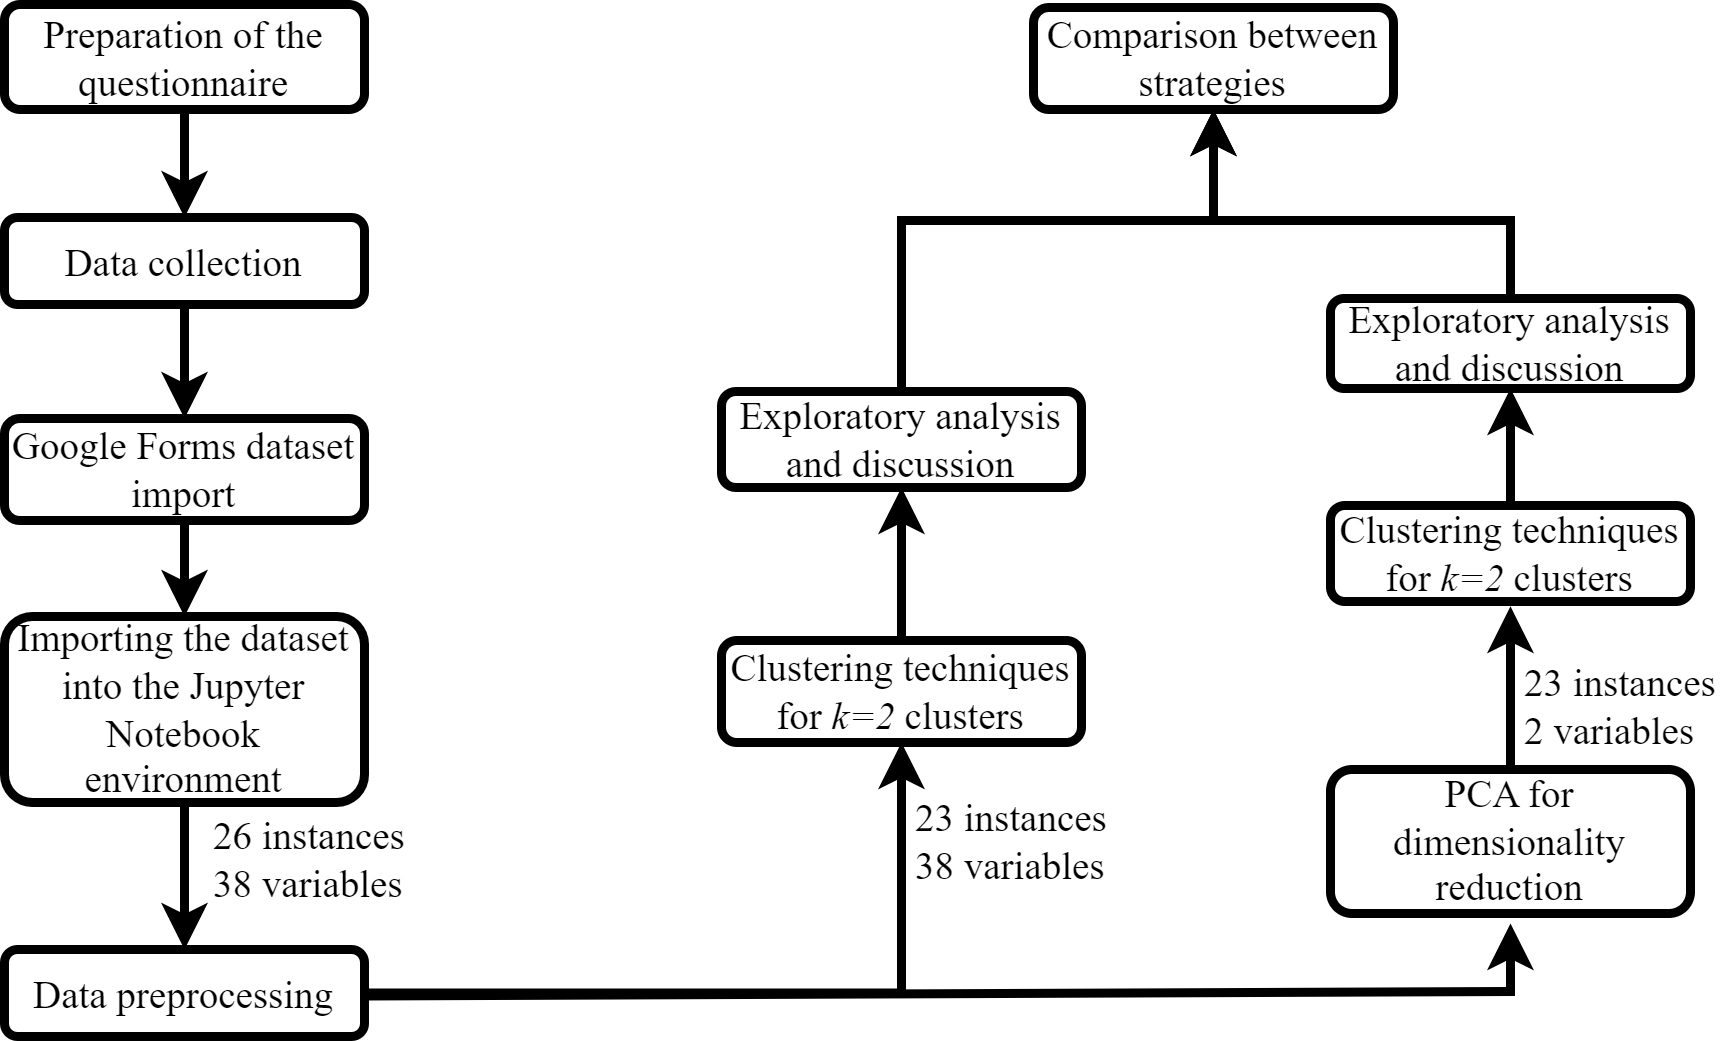
The data collection instrument utilized in this study was constructed through adaptations of the CIS 4 and PINTEC questionnaires and distributed to several companies in Londrina and its surrounding region. It is important to emphasize that several questions were posed concerning a period of three years, which is consistent with the interval utilized in 2004 in the CIS 4, and it was decided to maintain this time frame.
The data collection instrument consists of 38 questions divided into nine dimensions:
General company information (9 questions);
Innovation of goods and services (3 questions);
Innovation of processes (2 questions);
Innovative activities in implementation or discontinued (1 question);
Innovative activities and expenses (5 questions);
Sources of information and cooperation for innovative activities (2 questions);
Perceived effects of innovation in the company (10 questions);
Factors hindering innovation activities (5 questions);
Intellectual property rights (1 question).
The variables related to the mentioned dimensions are of different types, as highlighted in Table 1.
| Variables | Type | Variables | Type |
|---|---|---|---|
| name | Categorical - nominal | s7q21_bin | Binary or dichotomous |
| city | Categorical - nominal | s8q22_bin | Binary or dichotomous |
| zip code | Numeric | s9q23_cxs | Categorical – nominal |
| segment | Categorical - nominal | s10q24_bin | Binary or dichotomous |
| job position | Categorical - nominal | s11q25_lkt | Numeric - scalar |
| n_employees | Numeric | s11q26_lkt | Numeric - scalar |
| geographical_market | Categorical - nominal | s11q27_lkt | Numeric - scalar |
| foundation_year | Numeric | s11q28_lkt | Numeric - scalar |
| s1q10_lkt | Numeric - scalar | s11q29_lkt | Numeric - scalar |
| s2q11_bin | Binary or dichotomous | s11q30_lkt | Numeric - scalar |
| s3q12_mtpe | Categorical – nominal | s11q31_lkt | Numeric - scalar |
| s3q13_bin | Binary or dichotomous | s11q32_lkt | Numeric - scalar |
| s4q14_bin | Binary or dichotomous | s11q33_lkt | Numeric - scalar |
| s5q15_mtpe | Categorical – nominal | s12q34_lkt | Numeric - scalar |
| s6q16_bin | Binary or dichotomous | s12q35_lkt | Numeric - scalar |
| s7q17_lkt | Binary or dichotomous | s12q36_lkt | Numeric - scalar |
| s7q18_bin | Binary or dichotomous | s12q37_lkt | Numeric - scalar |
| s7q19_bin | Binary or dichotomous | s12q38_lkt | Numeric - scalar |
| s7q20_bin | Binary or dichotomous | s13q39_cxs | Categorical - nominal |
P.S.: Variables ending with “_lkt" represent Likert scale questions with four points; variables ending with “_bin" represent dichotomous questions; variables ending with “_mtpe" represent multiple-choice questions; variables ending with “_cxs" represent checkbox questions.
The k-means algorithm
The k-means algorithm is one of the most widely used unsupervised learning algorithms for solving various clustering problems (Condrobimo et al., 2016), in addition to being an exclusive clustering algorithm (also known as hard clustering), which means that each instance in the dataset is assigned to only one cluster, the k-means algorithm partitions the dataset into a number, \(k\), of clusters. It is necessary to define beforehand this number (input parameter to initiate the algorithm). This is perceived as a disadvantage of the method, thus, it is generally recommended to conduct tests by altering the value of k to find the optimal number of clusters that best divide the dataset (Sinaga & Yang, 2020).
It is important to emphasize that the k-means algorithm derives its name because it is a prototype-based clustering algorithm. Each cluster is based on a prototype, which in this case is the average of similar data points, referred to as a ‘centroid’ when the variables are continuous and ‘medoid’ when they are categorical (Raschka, 2015).
Silva, 2016 further explains that the k-means algorithm operates to minimize the sum of squared errors within clusters (the summation of the distance from each object to the centroid of the cluster to which it belongs), so that the formed groups are compact, have a spherical shape, and can be unbalanced.
According to James et al., 2017, the operation of k-means occurs through an iterative refinement technique.
That is, the allocation of objects to the cluster whose centroid is closest, combined with the update of centroid values, results in an iterative process of optimizing a cost function. This function calculates the sum of squared errors, as previously mentioned, the method aims to minimize it, equation (1):
(1)
\[ f_c = \sum_{i=1}^k \sum_{x\in g_i} d(x,~c_i),\]
where \(f_c\) is the cost function of the dataset, \(x\) is an instance, \(c_i\) is the centroid of the cluster \(g_i\) and \(d(x,~c_i)\) the distance between the instance and the centroid of the cluster (de Castro & Ferrari, 2016).
According to Goldschmidt et al., 2015, the iterative procedure of the k-means algorithm can be described in the following steps:
Initial centroids are randomly chosen;
Calculate the distance between each object in the sample and all centroids;
Assign each object to the nearest centroid;
Calculate new centroids using the mean of the objects assigned to each centroid. At this point, centroids may shift, leading to a new allocation of objects to clusters;
Repeat the previous steps until the algorithm no longer brings about changes in centroids and object allocations.
Figure 2 illustrates the iterations performed by the k-means algorithm.
| (a) | (b) | (c) |
 |  |  |
| (d) | (e) |
 |  |
From , by A. M. Ikotun, A. E. Ezugwu, L. Abualigah, B. Abuhaija, and J. Heming, 2023, Information Sciences, 622, 178–210.
Hierarchical clustering algorithm
The hierarchical clustering method involves the progressive inclusion of objects into groups, forming a multi-level hierarchical structure. It can be implemented following two approaches: agglomerative and divisive (Silva, 2016).
The divisive (top-down) method starts with all elements allocated in a single group, where in each iteration, the objects are divided into multiple clusters. On the other hand, the agglomerative (bottom-up) approach begins with n groups, where the sample has n elements, and these groups are successively merged at each iteration until forming only one cluster (Roux, 2018). Figure 3 depicts the approach utilized in this research (agglomerative method), represented by a dendrogram.
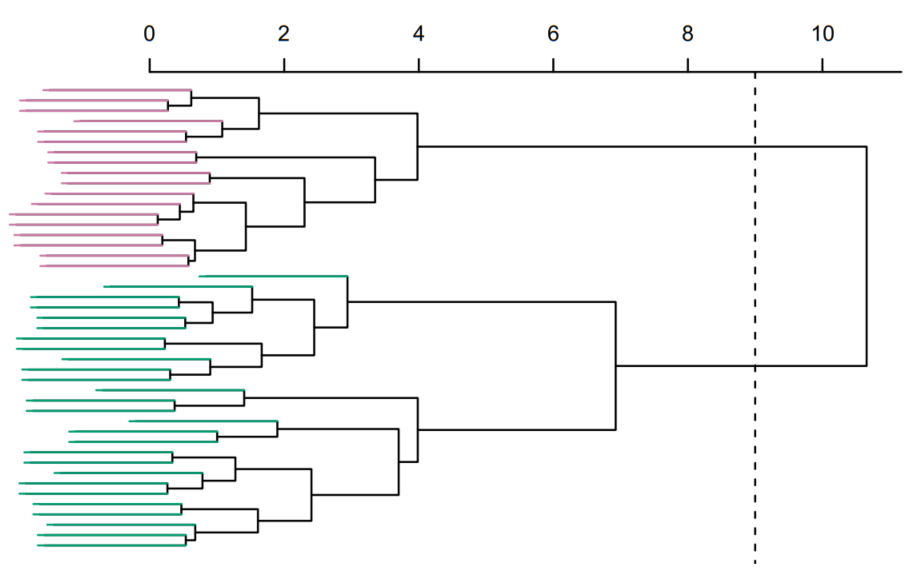
Adapted from “ (Vol. 1)”, by G. James, D. Witten, T. Hastie, R. Tibshirani, and J. Taylor, 2023, https://www.statlearning.com/
Hierarchical clusters are typically graphically represented by a model known as a dendrogram and use similarity as the distance measure in cluster formation (Silva, 2016). The similarity (or dissimilarity) criterion must be applied to each pair of objects or groups. This criterion works as follows: the lower the quantified distance value, the more similar the objects will be. Hence, the closer objects will be merged, forming a cluster, which will be identified as a new object. This process is repeated until the formation of a single group (James et al., 2023; Shannon, 2007).
Silva, 2016 says that the most commonly used techniques to apply distance measurement in pairs in the hierarchical method are: shortest distance or Nearest neighbors, Longest distance or Farthest neighbors, Average distance, Centroid distance, and finally, the Ward method. This latter method, considered more complex compared to the others, provides greater precision in the results and also minimizes the variance among elements, hence it is also known as the Minimum Variance method Eszergár-Kiss & Caesar, 2017.
The authors further state that the Ward method can be summarized in the following steps:
Data normalization, if necessary;
Calculation of the distance between clusters;
Agglomeration of the closest clusters.
It is worth noting that in the last step if a new cluster is formed, its distance from the other groups must be recalculated (Eszergár-Kiss & Caesar, 2017).
Principal Component Analysis (PCA)
Dimensionality reduction is a process employed when variables in the database display redundancy or correlation through a linear combination (Aidoo et al., 2021; Santos et al., 2019). Principal Component Analysis (PCA) serves as a mathematical tool that aims to represent the variance within the dataset using a reduced number of factors termed components (Granato et al., 2018).
PCA is also defined as a technique for extracting variables from a specific dataset, performing a linear combination of the original variables, and projecting new data that indicates directions of maximum variance in space. These directions explain the primary patterns of variation in the original data, obtained through the computation of the variance-covariance matrix of the initial database. This new set of variables is formed by uncorrelated variables known as principal components (Aidoo et al., 2021; Maćkiewicz & Ratajczak, 1993).
Reducing the dataset’s dimensionality offers an alternative to decreasing the computational time required for algorithm application, potentially enhancing its performance. However, this research aimed to decrease the number of variables to reduce the complexity of the variable set and identify more homogeneous groups.
Tools utilized in this work
The data collection instrument was created using Google Forms. The code development was carried out in Python 3.10.2, a highly powerful programming language, widely recognized as the most popular language in the field of data science. In this context, the Anaconda distribution (Anaconda, 2023) was used.
For importing and handling the database (pre-processing), the Pandas library was employed (The, 2020). Subsequently, for the application of algorithms, the Scikit-Learn library (Pedregosa et al., 2011) was utilized. Finally, the Matplotlib (Hunter, 2007) and Seaborn (Waskom, 2021) libraries were used for visualizing statistical results in the form of graphs.
Results
The obtained results were segregated based on demographic dimensions and characteristics related to innovation. The instance distributions (companies) from the four algorithms under analysis were reasonably balanced, exhibiting minimal differences, as depicted in Table [tab2].
| Algorithm | Number of Instances in Each Cluster | |
|---|---|---|
| Cluster 0 | Cluster 1 | |
| k-means | 10 | 13 |
| k-means + PCA | 10 | 13 |
| Hierarchical | 10 | 13 |
| Hierarchical + PCA | 12 | 11 |
According to Table [tab2], the first two techniques yielded the same distribution, having identical instances in each group. Despite the distributions of the K-means, K-means+PCA, and hierarchical clustering algorithms displaying identical distributions, there was a swap in the allocations of two companies - one from the industrial sector and the other from a service provider - resulting in an equal number of companies in each cluster.
Results regarding demographic variables
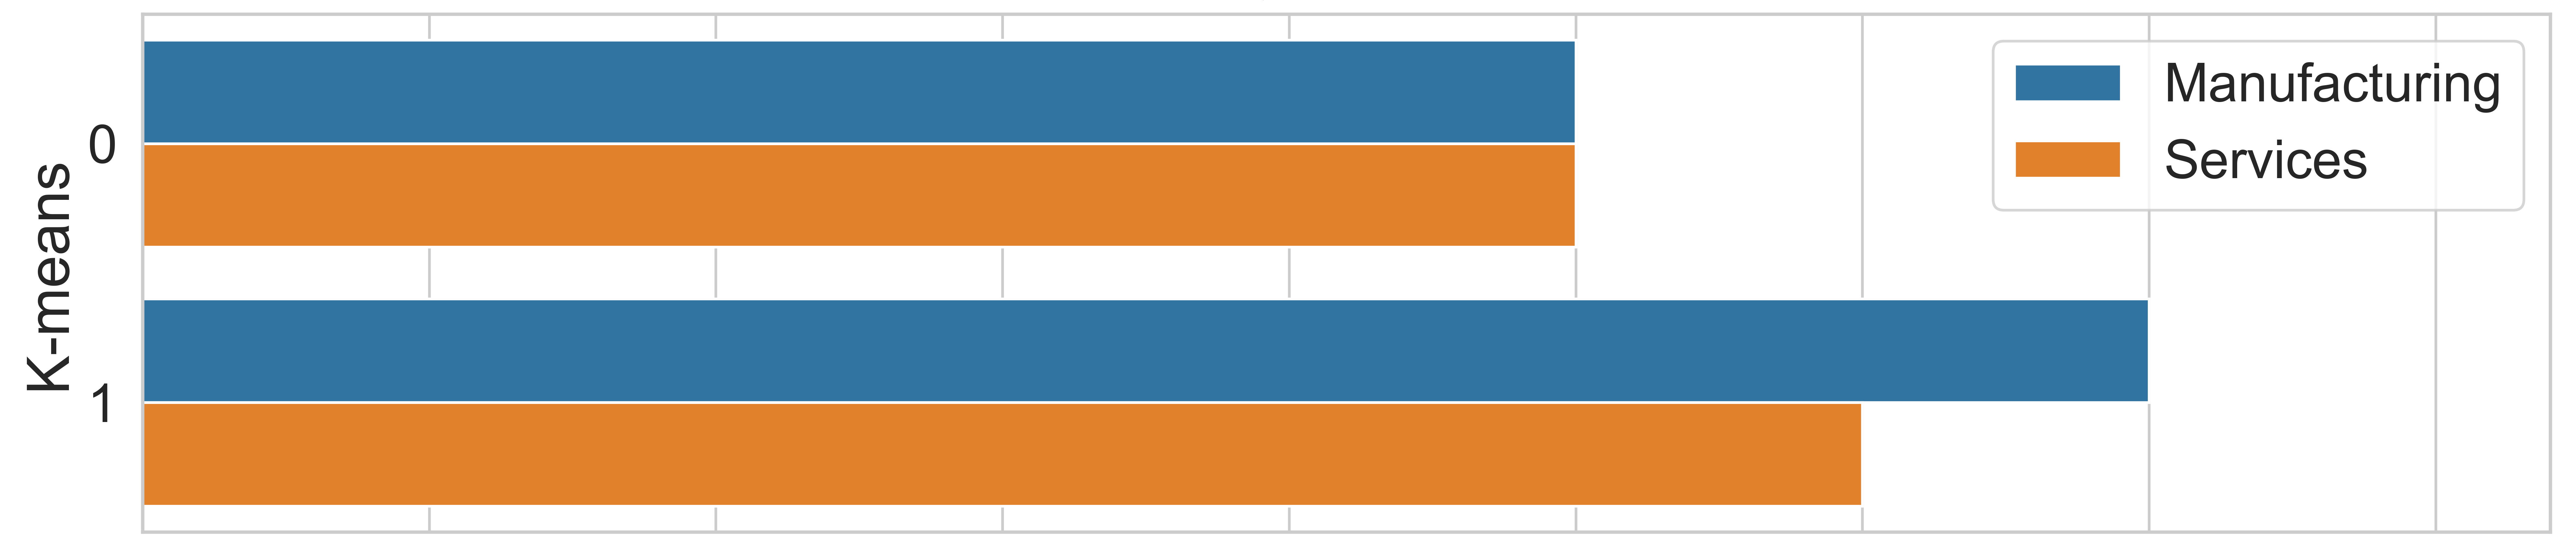
To perform a comparison among the algorithms concerning demographic characteristics, ‘segment’ was selected as the only attribute that differentiated the two clusters. Figure 4 displays the distribution of clusters by segment.
| (a) |
 |
| (b) |
 |
| (c) |
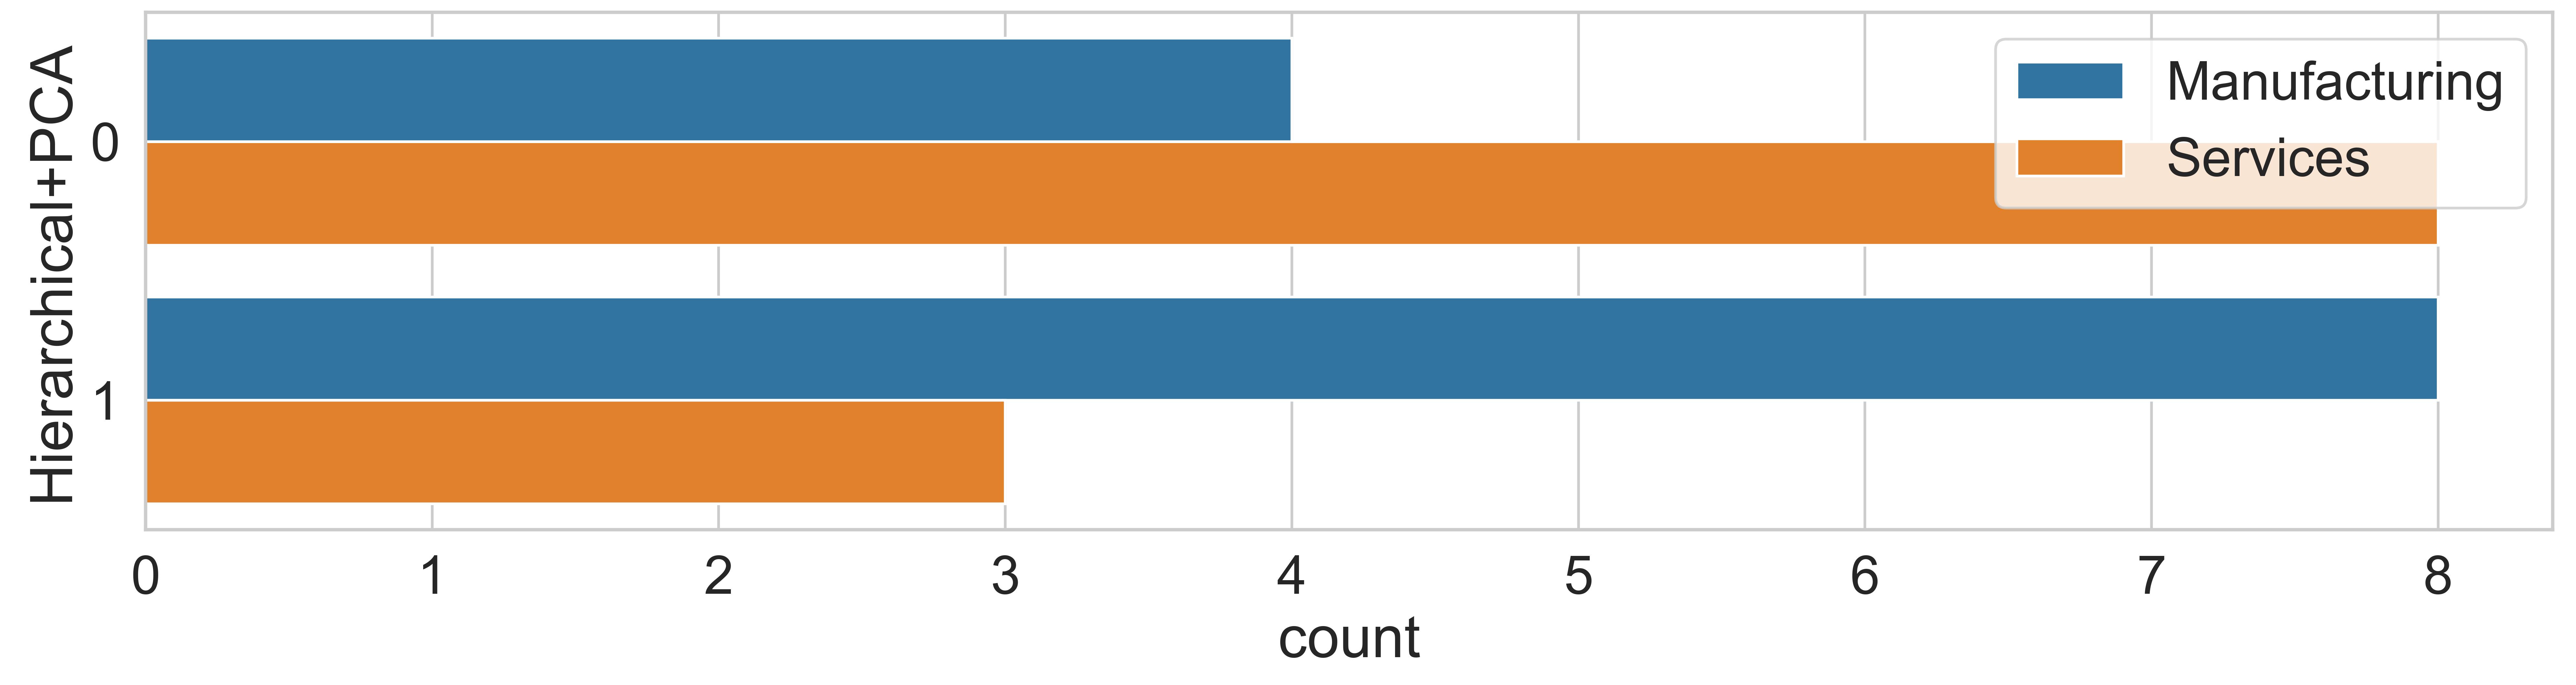 |
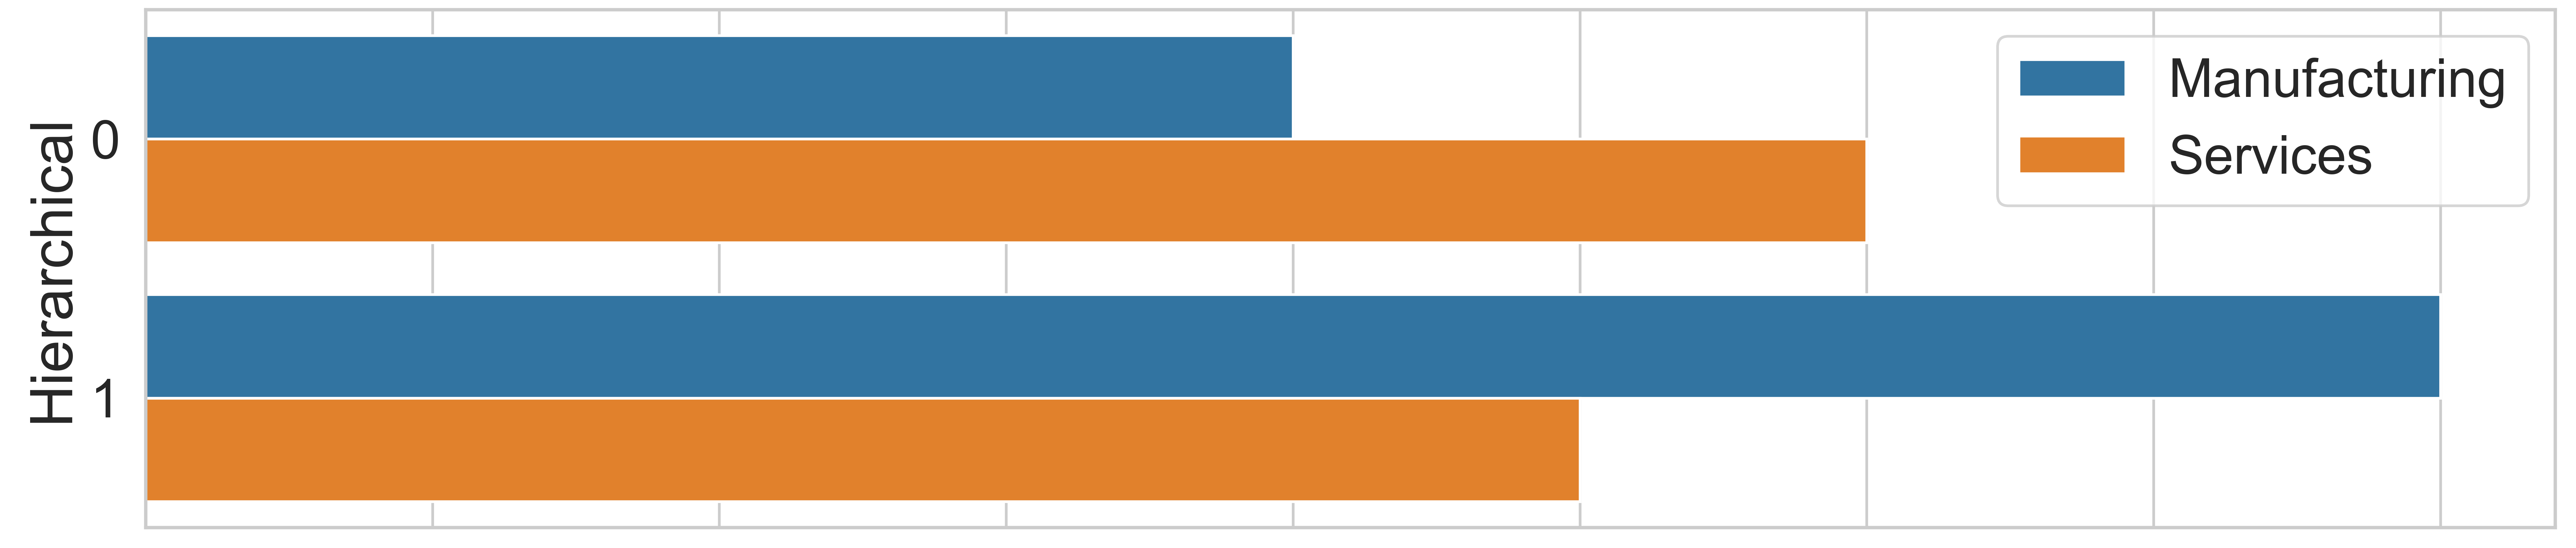
Figure 4(a) demonstrates that, as a result, the k-means technique allocated five service companies and five manufacturing companies to cluster 0, while cluster 1 comprised six service companies and seven manufacturing companies, showing no significant difference. However, concerning the hierarchical clustering technique, Figure 4(b), there is a divergence, as expected, due to the inversion in the allocation of two companies from different segments, as mentioned earlier. In this case, the distribution of service organizations was six in cluster 0 and five in cluster 1 (one less in each group compared to the previous technique). Meanwhile, the distribution of manufacturing companies was four in cluster 0 and eight in cluster 1, with one more in each group compared to the k-means algorithm.
Ultimately, the results obtained by the hierarchical+PCA algorithm, Figure 4(c), diverge even further from the outcomes of the initial techniques presented. In this algorithm, a better separation between service and manufacturing companies is evident, with cluster 0 having a higher concentration of service companies, totaling eight organizations (66.67 %) compared to four manufacturing companies (33.33 %). On the other hand, cluster 1 contained eight industrial sector companies (62.5 %) and only three service sector companies (37.5 %).
Results regarding innovation variables
In this subsection, the results of the clustering based on innovation variables are presented. Firstly, the swarm plot graph from the Seaborn library of the attribute ‘s7q17_lkt’ (Figure 5 is shown, which is associated with the respondent’s perception regarding the question of whether the company regularly invests in R&D, ranging from 1 (‘completely disagree’) to 4 (‘completely agree’).
| (a) | (b) | (c) |
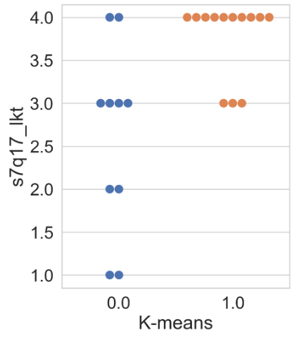 | 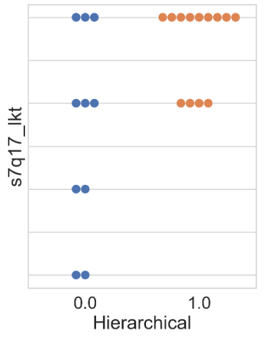 | 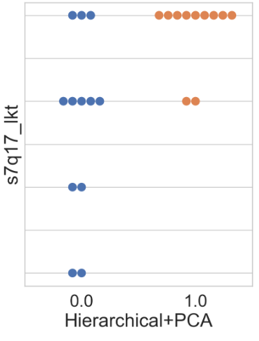 |
Figure 5 illustrates that the results obtained by all algorithms were similar. Differences among clusters are noticeable, where cluster 0 presents companies with varying degrees of agreement and disagreement regarding the statement. In other words, within cluster 0, there are companies that both regularly invest and do not invest in R&D. Regarding cluster 1, all companies agree with the statement, differing only in intensity, with a higher concentration in the ‘completely agree’ option. Thus, companies allocated in cluster 1 exhibit a higher regular investment in research and development than the others.
Previous studies such as Furtado et al., 2007 indicated that the intensity of R&D is considered an international indicator for comparing sectors and countries. Typically, this indicator is used to measure involvement in internal innovative activities within companies, as it is one of the main factors impacting the successful introduction of technological innovations (Aarstad & Kvitastein, 2020; Anzola-Román et al., 2018).
Other studies have presented corporate innovation as a function of R&D investments, as investments and efforts in developing internal sector competencies aim to leverage innovative outcomes (Anzola-Román et al., 2018; Mairesse & Mohnen, 2010).
Acs and Audretsch (2003) further affirm that more innovative countries are those with higher R&D investments, and industries considered more innovative tend to be characterized by significant investments in R&D and new economic knowledge.
In a subsequent analysis, the distribution of participants concerning the attribute “s9q23_cxs”, indicating the number (ranging from 0 to 4) of collaborations made between interviewed companies and other institutions (competing companies, suppliers, customers, universities, academic institutions, and government) with the aim of innovating, was demonstrated. The distribution is illustrated in Figure 6.
| (a) | (b) | (c) |
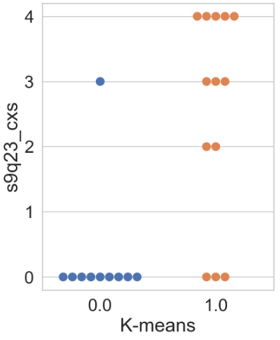 | 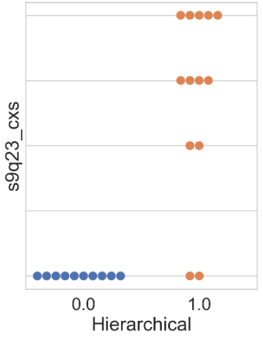 | 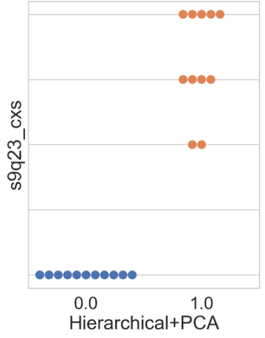 |
The results from Figure 6 reveal certain specificities. For the k-means algorithm in Figure 6(a), 90 % of the companies in cluster 0 did not engage in any partnership; only one company from this cluster reported having three types of partnerships for innovating, which could be considered an outlier for this cluster’s behavior. However, for the other two algorithms, hierarchical and hierarchical+PCA (Figures 6(b) and 6(c), respectively), all companies allocated in their cluster 0 did not engage in any partnership aiming at innovation.
For the k-means and hierarchical algorithms in Figures 6(a) and 6(b), the results for cluster 1 appeared similar, as in the former, three companies (23 %) reported no type of partnership, while in the latter, two companies (15 %) were in the same situation. The remaining organizations in these clusters engaged in at least two different types of partnerships, accounting for 77 % in k-means and 85 % in hierarchical clustering. Notably, in the hierarchical+PCA cluster 1, Figure 6(c), only companies that established two or more types of partnerships for innovation were allocated.
In this context, da Silva & Guerrini, 2021 affirm that innovation involves multiple agents, and the ability to join innovation networks is a viable means to achieve common goals through partnerships within the network. For some authors, the model of open and collaborative innovation represents a way to support efforts toward innovation using external resources, not present within the company (Luzzini et al., 2015).
Previous studies indicate that collaboration with different external actors (suppliers, competitors, customers, and research organizations such as universities) enhances not only knowledge sharing but also the acquisition of knowledge within a company, thereby expanding the existing knowledge base and consequently promoting a company’s innovation capability (Luzzini et al., 2015; Najafi-Tavani et al., 2018).
Other authors address the relationship between companies, universities, and the government as the “triple helix” and consider this interaction as the key to innovation, as well as knowledge-based economic and social growth (Etzkowitz & Zhou, 2017; Iata & Cunha, 2018). The triple helix is an ongoing process aiming to create an environment conducive to innovation and entrepreneurship (Etzkowitz & Zhou, 2017).
An example of successful interaction among the company-university-government is the Silicon Valley, which initially had double helix interactions between company-university and company-government. Subsequently, with the assistance of the regional government authorities and through extensive exchange between these double helices, they formed what is known as the triple helix (Etzkowitz & Zhou, 2017).
Finally, selected for discussion is the graph related to the attribute “s13q39_cxs” (Figure 7, which inquires whether the organization has applied for any patents and/or registrations in the last three years, ranging from “0” to “4”, with the value “4” indicating that the company has applied / registered for a patent, industrial design, trademark, and copyrights.
| (a) | (b) | (c) |
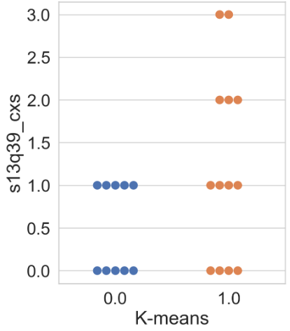 | 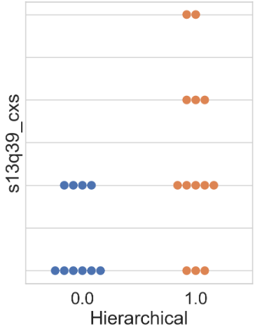 | 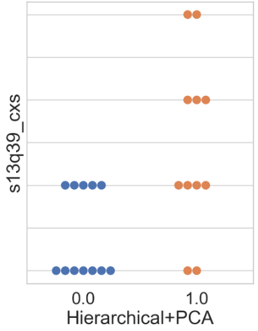 |
For the results presented in Figure 7, the outcomes from the three algorithms were similar. In cluster 0, companies are divided between those that did not make any requests or registrations in the last three years and those that made only one type of request or registration during that period.
Meanwhile, within the formed cluster 1, some companies did not make any requests or registrations, while others made up to three different types in the three years. In the k-means algorithm, Figure 7(a), 30.75 % of the companies in cluster 1 did not make any type of registration, compared to 23 % in the hierarchical clustering and 18.2 % in the hierarchical+PCA (Figures 7(b) and 7(c), respectively).
According to Basberg, 1987, data and statistics related to this attribute are used to measure technological changes and analyze technology diffusion among countries and companies. The author further states that the use of patent statistics assumes that they reflect the incentive for innovation activities.
Bolívar-Ramos, 2017 suggests that expenditures on R&D and patents are considered two critical strategic resources for a company’s success and are closely related. With increased investment in R&D, organizations produce more knowledge, increasing the chances of developing patentable inventions. The author also highlights patenting as a more robust legal form of protecting R&D results, limiting competitors’ ability to copy and duplicate inventions. This secures returns from R&D investments for the company and helps maintain its competitive advantage derived from the invention (Bolívar-Ramos, 2017; Ceccagnoli, 2009).
Conclusions and future work
This work employed unsupervised machine learning techniques to form clusters of companies from Londrina and its surrounding region, discussing how variables related to innovation differentiate among the formed clusters.
The research database was obtained by applying a data collection instrument created by the authors with adaptations from CIS 4 and PINTEC. Subsequently, data preprocessing was performed to quantify categorical variables (discretization) and then normalize all the data present in the database.
Following this, four clustering algorithms were applied, defined as k-means, k-means+PCA, hierarchical, and hierarchical+PCA. The results obtained from the first algorithms were identical, both in the quantity and allocation of instances in each group. The hierarchical clustering algorithm obtained the same number of instances allocated in groups as the k-means techniques but with an inversion of allocation of two organizations, yielding similar outcomes to the initial techniques.
Lastly, the last algorithm (hierarchical+PCA) exhibited the most significant difference in the distribution and allocation of companies in each cluster. This algorithm better-separated instances concerning the “segment” attribute (Figure 4), allocating more service providers to cluster 0 and more manufacturing companies to cluster 1. Despite these differences observed in the results section, the algorithm achieved very similar outcomes to the hierarchical clustering concerning variables related to innovation.
From the results discussed in the previous section, it is noticeable that, for all algorithms, cluster 1 achieved scores closer to higher values in the context of innovation compared to cluster 0. This indicates a more apparent concern with factors significantly contributing to companies, such as regular investment in R&D, a higher number of partnerships with other types of institutions to innovate, and types of requests and/or registrations in the last three years.
Therefore, it can be concluded that, for this sample of analyzed companies, cluster 1 presented companies with more concerns and efforts in the context of innovation compared to cluster 0. Finally, when analyzing the demographic results, particularly the hierarchical+PCA clustering algorithm’s outcome regarding the “segment” attribute, the cluster obtained 67 % of service sector companies, while cluster 1 showed 73 % industries, suggesting slightly that the industries in this sample possess more innovative characteristics than service-oriented ones.
According to de Castro et al., 2020, this happens because the concept of innovation in the service sector emerged after innovation in industries. Initially, the service sector adopted technological innovations produced in industries, resulting in fewer innovations within its sector (Kon, 2016).
For Kinoshita et al., 2013, there has been an increase in the number of service providers along with their economic importance due to their contribution to the Gross Domestic Product (70 % of the Brazilian GDP), and being the sector that employs the most in Brazil, as indicated by the IBGE in a survey conducted in 2022 (Governo, 2022). With the expansion of this sector and the rise in competition, service providers have invested in innovation to survive in the market and achieve competitive advantages (Kinoshita et al., 2013).
Kon, 2016 demonstrates that innovations developed by the service sector often go unnoticed because there isn’t a tangible product associated, making it more difficult to define changes in the production or consumption of that good resulting from innovation.
Despite the previous statements, it’s not possible to generalize these grouped characteristics to all companies in Londrina and its surrounding region due to the small sample size of the analyzed dataset.
For more robust and generalizable results, obtaining more responses from companies in Londrina and its region would be necessary to form more robust clusters, aiming for possible validation of the results found in this research. Hence, future research might include more data from non-participating companies, incorporating other clustering algorithms, as well as hypothesis testing to assess statistical differences between the formed clusters.
Author contributions
A. P. B. de Morais participated in: Conceptualization, Data Curation, Formal Analysis, Investigation, Methodology, Programs, Resources, Writing - original draft. M. S. Dias participated in: Visualization, Programs, Formal Analysis, Resources, Writing - revision and editing. B. S. dos Santos participated in: Data Curation, Formal Analysis, Supervision, Validation, Writing - original draft. R. H. P. Lima participated in: Validation, Visualization, Writing - revision and editing. P. R. de L. Andrade participated in: Visualization, Writing - revision and editing.
Conflicts of interest
The authors declare no conflict of interest.
Acknowledgments
The authors would like to thank the Research Group on Optimization and Data Mining (Grupo de Pesquisa em Otimização e Mineração de Dados - GPOMD) and the companies that participated in this study.
References
Aarstad, J. & Kvitastein, O. A. (2020). Enterprise R&D investments, product innovation and the regional industry structure. Taylor & Francis. 54(3), 366--376. https://doi.org/10.1080/00343404.2019.1624712
Aidoo, E. N., Appiah, S. K., Awashie, G. E., Boateng, A. & Darko, G. (2021). Geographically weighted principal component analysis for characterising the spatial heterogeneity and connectivity of soil heavy metals in Kumasi, Ghana. Elsevier BV. 7(9), e08039. https://doi.org/10.1016/j.heliyon.2021.e08039
Akman, G., Yorur, B., Boyaci, A. I. & Chiu, M.-C. (2023). Assessing innovation capabilities of manufacturing companies by combination of unsupervised and supervised machine learning approaches. Elsevier BV. 110735. https://doi.org/10.1016/j.asoc.2023.110735
Alam, S., Dobbie, G., Koh, Y. S., Riddle, P. & Ur Rehman, S. (2014). Research on particle swarm optimization based clustering: A systematic review of literature and techniques. Elsevier BV. 1--13. https://doi.org/10.1016/j.swevo.2014.02.001
Anaconda (2023). Anaconda: The Operating System for AI.
Anzola-Román, P., Bayona-Sáez, C. & GarcÃa-Marco, T. (2018). Organizational innovation, internal R&D and externally sourced innovation practices: Effects on technological innovation outcomes. Elsevier BV. 233--247. https://doi.org/10.1016/j.jbusres.2018.06.014
Barney, J. (2010). Gaining and Sustaining Competitive Advantage. Pearson.
Basberg, B. L. (1987). Patents and the measurement of technological change: A survey of the literature. Elsevier BV. 16(2--4), 131--141. https://doi.org/10.1016/0048-7333(87)90027-8
BolÃvar-Ramos, M. T. (2017). The relation between R&D spending and patents: The moderating effect of collaboration networks. Elsevier BV. 26--38. https://doi.org/10.1016/j.jengtecman.2017.11.001
Ceccagnoli, M. (2009). Appropriability, Preemption, and Firm Performance. Wiley. 30(1), 81--98. https://doi.org/10.1002/smj.723
Claudino, T. B., Santos, S. M. dos, Cabral, A. C. de A. & Pessoa, M. N. M. (2017). Fostering and limiting factors of innovation in Micro and Small Enterprises. Elsevier BV. 14(2), 130--139. https://doi.org/10.1016/j.rai.2017.03.007
Condrobimo, A. R., Sano, A. V. D. & Nindito, H. (2016). The Application Of K-Means Algorithm For LQ45 Index on Indonesia Stock Exchange. Petra Christian University. 7(2), 151. https://doi.org/10.21512/comtech.v7i2.2256
Confederação Nacional da Indústria [CNI] (2021). Inovação na indústria: Pesquisa com lÃderes empresariais.
da Silva, A. L. & Guerrini, F. M. (2021). Reference model for building innovation networks in information technology. Federal University of São Carlos. 28(3), 1-20. https://doi.org/10.1590/1806-9649-2021v28e4651
de Carvalho, H. G., dos Reis, D. R. & Cavalcante, M. B. (2011). Gestão da inovação. Aymará.
de~Castro, L. N. & Ferrari, D. G. (2016). Introdução à mineração de dados: Conceitos básicos, algoritmos e aplicações. Saraiva Uni.
de Castro, R. G., da Silva, J. F. & Paula, F. O. de (2020). Inovação de serviço e seu impacto no desempenho financeiro. FUMEC University. 21(1), 86--102.
Eszergár-Kiss, D. & Caesar, B. (2017). Definition of user groups applying Ward’s method. Elsevier BV. 25--34. https://doi.org/10.1016/j.trpro.2017.03.004
Etzkowitz, H. & Zhou, C. (2017). Hélice TrÃplice: inovação e empreendedorismo universidade-indústria-governo. University of São Paulo. 31(90), 23--48. https://doi.org/10.1590/s0103-40142017.3190003
Fayyad, U., Piatetsky-Shapiro, G. & Smyth, P. (1996). From Data Mining to Knowledge Discovery in Databases. AAAI. 17(3), 37--53. https://doi.org/10.1609/aimag.v17i3.1230
Furtado, A., Quadros, R. & Domingues, S. A. (2007). Intensidade de P&D das empresas brasileiras. Scielo. 3(6), 26--27.
Galvão, N. D. & Marin, H. de F. (2009). Técnica de mineração de dados: uma revisão da literatura. Universidade Federal de São Paulo. 22(5), 686--690. https://doi.org/10.1590/S0103-21002009000500014
Goldschmidt, R., Passos, E. & Bezerra, E. (2015). Data mining: conceitos, técnicas, algoritmos, orientações e aplicações. Gen LTC.
Governo Federal (2022). Serviços crescem pelo quarto mês seguido, aponta IBGE.
Granato, D., Santos, J. S., Escher, G. B., Ferreira, B. L. & Maggio, R. M. (2018). Use of principal component analysis (PCA) and hierarchical cluster analysis (HCA) for multivariate association between bioactive compounds and functional properties in foods: A critical perspective. Elsevier BV. 83--90. https://doi.org/10.1016/j.tifs.2017.12.006
Huang, X., Ma, L., Li, R. & Liu, Z. (2020). Determinants of Innovation Ecosystem in Underdeveloped Areas—Take Nanning High-Tech Zone in Western China as an Example. MDPI AG. 6(4), 135. https://doi.org/10.3390/joitmc6040135
Hunter, J. D. (2007). Matplotlib: A 2D Graphics Environment. IEEE Computer Society. 9(3), 90--95. https://doi.org/10.1109/MCSE.2007.55
Iata, C. & Cunha, C. J. C. de A. (2018). A Atuação da TrÃplice Hélice em Santa Catarina pela Visão dos Núcleos de Inovação Tecnológica (NITs) do Estado. Federal University of Santa Catarina. 8(4), 180--188. https://doi.org/10.22279/navus.2018.v8n4.p180-188.737
Ikotun, A. M., Ezugwu, A. E., Abualigah, L., Abuhaija, B. & Heming, J. (2023). K-means clustering algorithms: A comprehensive review, variants analysis, and advances in the era of big data. Elsevier BV. 178--210. https://doi.org/10.1016/j.ins.2022.11.139
James, G., Witten, D., Hastie, T. & Tibshirani, R. (2017). An Introduction to Statistical Learning. Springer. https://doi.org/10.1007/978-1-4614-7138-7
James, G., Witten, D., Hastie, T., Tibshirani, R. & Taylor, J. (2023). An Introduction to Statistical Learning with Applications in Python. Springer.
Kinoshita, K. F., Cirani, C. B. & da Silva, W. N. (2013). A Inovação em Serviços no Brasil: uma Comparação Internacional.
Kon, A. (2016). Ecossistemas de inovação: a natureza da inovação em serviços. 7(1), 15-27. https://doi.org/10.13059/racef.v7i1.170
Liu, Y., Liang, C. C. & Phillips, F. (2020). Precursors of intellectual property rights enforcement in East and Southeast Asia. Elsevier BV. 133--142. https://doi.org/10.1016/j.indmarman.2020.06.013
Luzzini, D., Amann, M., Caniato, F., Essig, M. & Ronchi, S. (2015). The path of innovation: purchasing and supplier involvement into new product development. Elsevier BV. 109--120. https://doi.org/10.1016/j.indmarman.2015.02.034
Ma, X., Hao, Y., Li, X., Liu, J. & Qi, J. (2023). Evaluating global intelligence innovation: An index based on machine learning methods. Elsevier BV. 1-17. https://doi.org/10.1016/j.techfore.2023.122736
Maćkiewicz, A. & Ratajczak, W. (1993). Principal components analysis (PCA). Elsevier BV. 19(3), 303--342. https://doi.org/10.1016/0098-3004(93)90090-R
Mairesse, J. & Mohnen, P. (2010). Using Innovation Surveys for Econometric Analysis.. Elsevier. 1129--1155. https://doi.org/10.1016/S0169-7218(10)02010-1
Najafi-Tavani, S., Najafi-Tavani, Z., Naudé, P., Oghazi, P. & Zeynaloo, E. (2018). How collaborative innovation networks affect new product performance: Product innovation capability, process innovation capability, and absorptive capacity. Elsevier BV. 193--205. https://doi.org/10.1016/j.indmarman.2018.02.009
Organization for Economic Co-operation & Developmen [OECD] (2018). Oslo Manual 2018: Guidelines for Collecting, Reporting and Using Data on Innovation. OECD. https://doi.org/10.1787/9789264304604-en
Pedregosa, F., Varoquaux, G., Gramfort, A., Michel, V., Thirion, B., Grisel, O., Blondel, M., Prettenhofer, P., Weiss, R., Dubourg, V., Vanderplas, J., Passos, A., Cournapeau, D., Brucher, M., Perrot, M. & Duchesnay, É. (2011). Scikit-learn: Machine Learning in Python. 12(85), 2825--2830.
Raschka, S. (2015). Python Machine Learning. Packt Publishing Ltd.
Rhoden, I., Weller, D. & Voit, A. K. (2022). Spatio-Temporal Dynamics of European Innovation—An Exploratory Approach via Multivariate Functional Data Cluster Analysis. MDPI AG. 8(1), 1-23. https://doi.org/10.3390/joitmc8010006
Robinson, S. & Stubberud, H. A. (2012). Issues in innovation for Norwegian SMES. The DreamCatchers Group, LLC. 11(1), 53--62.
Roux, M. (2018). A Comparative Study of Divisive and Agglomerative Hierarchical Clustering Algorithms. Springer. 35(2), 345--366. https://doi.org/10.1007/s00357-018-9259-9
Santos, R. de O., Gorgulho, B. M., Castro, M. A. de, Fisberg, R. M., Marchioni, D. M. & Baltar, V. T. (2019). Principal Component Analysis and Factor Analysis: differences and similarities in Nutritional Epidemiology application. Associação Brasileira de Saúde Coletiva (ABRASCO). 1-14. https://doi.org/10.1590/1980-549720190041
Shannon, W. D. (2007). Cluster Analysis (pp. 342-366). 342--366. https://doi.org/10.1016/S0169-7161(07)27011-7
Silva, L. A. (2016). Introdução à Mineração de Dados com aplicações em R. Gen LTC.
Sinaga, K. P. & Yang, M.-S. (2020). Unsupervised K-Means Clustering Algorithm. IEEE. 80716--80727. https://doi.org/10.1109/ACCESS.2020.2988796
The pandas development team (2020). Pandas.
Waskom, M. (2021). seaborn: statistical data visualization. 6(60), 3021. https://doi.org/10.21105/joss.03021
Zaini, W. M. F., Lai, D. T. C. & Lim, R. C. (2022). Identifying patent classification codes associated with specific search keywords using machine learning. Elsevier BV. 1-10. https://doi.org/10.1016/j.wpi.2022.102153
Zengin, K., Esgi, N., Erginer, E. & Aksoy, M. E. (2011). A sample study on applying data mining research techniques in educational science: Developing a more meaning of data. Elsevier BV. 4028--4032. https://doi.org/10.1016/j.sbspro.2011.04.408
Zhou, J. & Luo, Q. (2023). Influence factor studies based on ensemble learning on the innovation performance of technology mergers and acquisitions. Elsevier BV. 1-23. https://doi.org/10.1016/j.matcom.2023.07.012
Acs, Z. J., & Audretsch, D. B. (Eds.). (2003). Handbook of Entrepreneurship Research (pp.55-79). Springer. https://link.springer.com/chapter/10.1007/0-387-24519-7_4