
Efficiency of ZnO Nanoparticles in the Treatment of Effluent Contaminated with Remazol Yellow Gold

DOI 10.5433/1679-0375.2024.v45.49498
Citation Semin., Ciênc. Exatas Tecnol. 2024, v. 45: e49498
Received: 29 November 2023; Received in revised for: 9 February 2024; Accepted: 23 February 2024; Available online: 28 March 2024.
Abstract:
Zinc oxide (ZnO) was synthesized by the short-time microwave-assisted hydrothermal method and characterized by X-Ray Diffraction, Scanning Electron Microscopy and adsorption-desorption techniques. The photocatalytic activity of ZnO was evaluated on the basis of the degradation of gold yellow remazol azo dye (RNL) in the presence of UVC irradiation. The effects of dye concentration, photocatalyst mass, and pH of the dye solution was investigated. The characterizations of the material showed the formation of a hexagonal phase with a high long-range order and the formation of particle aggregates, resulting in a quasi-spherical morphology. Photocatalysis experiments showed a high photocatalytic efficiency (92 %) in dye degradation over a short period of time. Under acidic conditions and low dye concentrations, the photocatalytic effect was more effective. RNL photodegradation followed the pseudo-first-order kinetic model. The Langmuir-Hinshelwood (L-H) model was used to describe the photocatalytic process.
Keywords: zinc oxide, photocatalytic degradation, hydrothermal method, azo dye
Introduction
Azo dyes are organic compounds with chemically complex structures represented by the \(\mathrm{R-N=N-R'}\) bond (chromophore group), where \(\mathrm{R}\) and \(\mathrm{R'}\) can be aryl or alkyl compounds. Such compounds are widely used in the textile, paper and food industries (Alsantali et al., 2022; Benkhaya et al., 2020; Vaiano & De Marco, 2023). This class of dyes pollutes the aquatic environment, reducing light penetration and solubility, interfering the photosynthetic potential of phytoplankton, altering the pH, increasing biochemical and chemical oxygen demands (Alzain et al., 2023).
Due to good stability under environmental conditions, effluents containing azo dyes can cause serious environmental problems. Because, when dumped into lakes, rivers or groundwater, they favor the contamination of bodies of water, causing health risks due to their lethal effect, genotoxicity, mutagenicity and carcinogenicity (Chung, 2016). A study indicated that 98% of organic azo dyes were lethal to fish (LC50) at a concentration greater than \(1~\text{mg.L}^{-1}\) (Carmen & Daniela, 2012).
The azo dyes toxicity is due to the formation of aromatic amines or the benzidine molecule under reductive conditions. After toxic aromatic amine intermediates released into water through reduction, they can damage vital organs such as the liver, kidney, central nervous system, and reproductive system in humans and prevent photosynthesis in plants (Uday et al., 2016; Weldegebrieal, 2020). Some studies indicate that benzidine has a direct relationship with human bladder cancer. Additionally, there is a higher incidence of bladder cancer in dyers exposed to azo dyes (Puvaneswari et al., 2006).
In this context, Advanced Oxidative Processes (AOPs) have received special attention in the treatment of effluents containing organic dyes, as they have proven to be efficient in the treatment, since, by producing free radicals, they cause chain reactions, therefore making the treatment effective of decontamination process (Vaiano & De Marco, 2023; Yassumoto et al., 2009). Among AOPs, heterogeneous photocatalysis using semiconductors has been widely investigated and has shown good results, as it favors the mineralization of organic dyes into \(\text{H}_2\text{O}\), \(\text{CO}_2\) and mineral acids, without causing secondary pollution (Chen et al., 2017).
Zinc oxide (ZnO) is one of the most used semiconductors in heterogeneous photocatalysis processes due to its high redox potential, low cost, non-toxicity and for being an ecological catalyst due to its harmless nature (Manikanika & Chopra, 2022). Some studies report that ZnO exhibits greater efficiency in the photocatalytic degradation of some organic dyes than \(\text{TiO}_2\) (Ansari et al., 2013; Lee et al., 2015).
Several methods have been used for the synthesis of ZnO nanostructures such as solid state reaction, chemical precipitation, sol-gel, ultrasonic solvothermal (Surbhi et al., 2023; Weldegebrieal, 2020). However, the hydrothermal method is the most promising due to its simplicity and low cost. However, several syntheses based on this method took several hours to complete. The introduction of microwave irradiation in the hydrothermal method promotes an increase in crystallization kinetics by one or more orders of magnitude, resulting in shorter reaction times (Schimidt et al., 2022; Sun et al., 2016; Komarneni et al., 1992).
Hasanpoor et al., 2015 synthesized ZnO nanoparticles using the microwave-assisted hydrothermal method. The authors found that changes in microwave power and irradiation time promoted changes in the morphology of the material. Alfarisa et al., 2019, using the same synthesis method, synthesized ZnO micro-nanostructures in a fast time. According to the authors, the rapid heating process generated from the rotation, friction and collisions of water molecules inside the microwave resulted in a faster reaction process compared to the conventional hydrothermal method.
This work presents the rapid ZnO synthesis nanoparticles by the microwave-assisted hydrothermal method and its application as a photocatalyst for the degradation of the azo organic dye yellow gold remazol (RNL). A study of the reaction kinetics correlating the reaction conditions, mechanism and properties of the photocatalyst was evidenced.
Materials and methods
Synthesis of ZnO nanoparticles
Zinc oxide (ZnO) nanoparticles were synthesized by the microwave-assisted hydrothermal method as described by Quirino et al., 2017. In the present work, a zinc nitrate solution was prepared, \(\text{(Zn(NO}_3\text{)}_2\text{.6H}_2\text{O}\), 98 %, SIGMA-ALDRICH) with a concentration of \(9~\text{mmol.L}^{-1}\). In \(132\) mL of this solution, \(8\) mL of a sodium hydroxide solution (NaOH, 98 %, VETEC), with \(\text{5 mol.L}^{-1}\) concentration, and \(3.6\) g of polyethylene glycol (PEG \(400\), U.S.P., SYNTH) were added.
The precursor solution was transferred to a sealed Teflon autoclave and placed in a microwave reactor, undergoing microwave-assisted hydrothermal treatment (\(f = 2450\) MHz, maximum power = \(800\) W). The synthesis was carried out at \(100\) ºC for 5 min and heating rate of \(20\text{ ºC.min}^{-1}\). After hydrothermal treatment, a white precipitate formed, which was washed repeatedly with distilled water until neutral pH. Subsequently, the material was filtered and transferred to an oven for drying at \(110\) ºC for \(12\) h. The sample was named ZONa05P.
Characterization
The synthesized material was characterized by X-ray diffraction (XRD) techniques using a diffractometer (XRD-6000, Shimadzu) operating at \(40\) kV and \(40\) mA with \(\text{CuK}\alpha\) radiation. The diffractograms were collected in the range of \(15\text{º}-80\text{º}~(2\theta)\), using a step of \(0.02\)º and a step time of \(2\) s. The average crystallite size (\(\varepsilon\)) was determined by the Debye-Scherrer equation, as described in equation (1),
\[ \varepsilon = \frac{K\lambda}{\beta\cos{\theta}},\] where \(K\) is form factor; \(\lambda\) is the wavelength; \(\beta\) is the peak width at half height; \(\theta\) is the Bragg diffraction angle.
The agglomerates morphology of the obtained sample was observed using a scanning electron microscope, SEM (Philips, XL30). The textural characteristics of the sample (surface area, pore size and pore volume) were determined by the nitrogen adsorption and desorption technique using the BET (Brunauer, Emmett and Teller) and BJH (Barret, Joyner and Halenda) methods in a ASAP 2000 Micromeritics device.
Photocatalytc tests
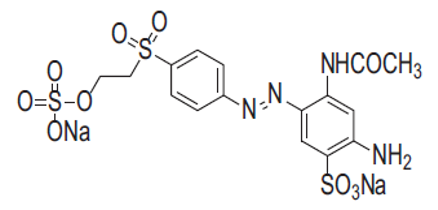
The sample ZONa05P was evaluated as a photocatalyst in the degradation of the azo dye Remazol Yellow Gold (RNL), from Dystar. The dye has the molecular formula \({\text{CH}_{16}\text{N}_{4}\text{O}_{10}\text{S}_3\text{Na}_2}\), molar weight 566.49 \(\text{g.mol}^{-1}\) and 1 azo bond in its structure, Figure 1.
In order to understand how to reduce the action of possible interferers in the photocatalysis process, it was decided to prepare aqueous solutions of the azo dye RNL in order to simulate possible effluents. In this way, stock solutions were prepared with concentrations of \(0.01\text{ mmol.L}^{-1}\), \(0.03\text{ mmol.L}^{-1}\), \(0.05\text{ mmol.L}^{-1}\), \(0.07\text{ mmol.L}^{-1}\) and \(0.09\text{ mmol.L}^{-1}\). pH adjustments (\(2\), \(4\), \(6\), \(8\) and \(10\)) were carried out using HCl and NaOH solutions both at \(0.1\text{ mol.L}^{-1}\).
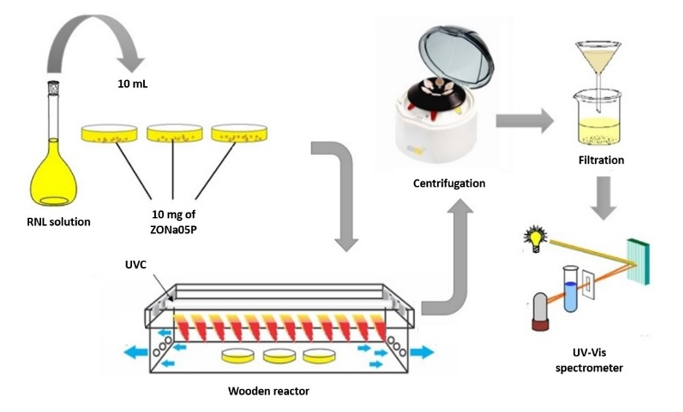
The photocatalytic tests were carried out in a rectangular wooden reactor, with dimensions of \(10~\text{cm}~\times~20~\text{cm}~\times~100 ~\text{cm}\), using a UVC lamp (\(\lambda\) = \(254\) nm, ILUMISAMPA). The experiments were tested in Petri dishes, in triplicates, using masses of \(5\) mg, \(10\) mg, \(15\) mg and \(20\) mg of the photocatalyst (ZONa05P) and \(10\) mL of the RNL dye solution at different initial concentrations.
The mixtures were photoirradiated for a period of \(10\) to \(80\) min. After photocatalysis, the samples were centrifuged and filtered as shown in Figure 2. The percentage of decolorization and degradation of the dye solutions was quantified using a UV-vis spectrophotometer (UV-2550, Shimadzu) by measuring the absorbance of the RNL solution in \(411\) nm, which is directly associated with the chromophoric group (\(\mathrm{-N=N-}\)) (Catanho et al., 2006). The removal rate (R %) of the azo dye was calculated by equation (2):
\[ \text{R}\%= \frac{C_0-C_t}{C_0}\cdot100~\%,\]
where \(C_0\) and \(C_t\) are the concentrations of the azo dye before photocatalysis and at different irradiation times, respectively.
Results and Discussions
Characterization of ZnO nanoparticles
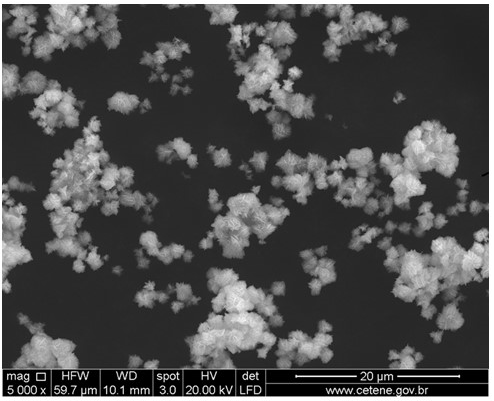
Figure 3 presents the results of the characterization of ZONa05P synthesized in a short time by the microwave-assisted hydrothermal method.
| (a) | (b) |
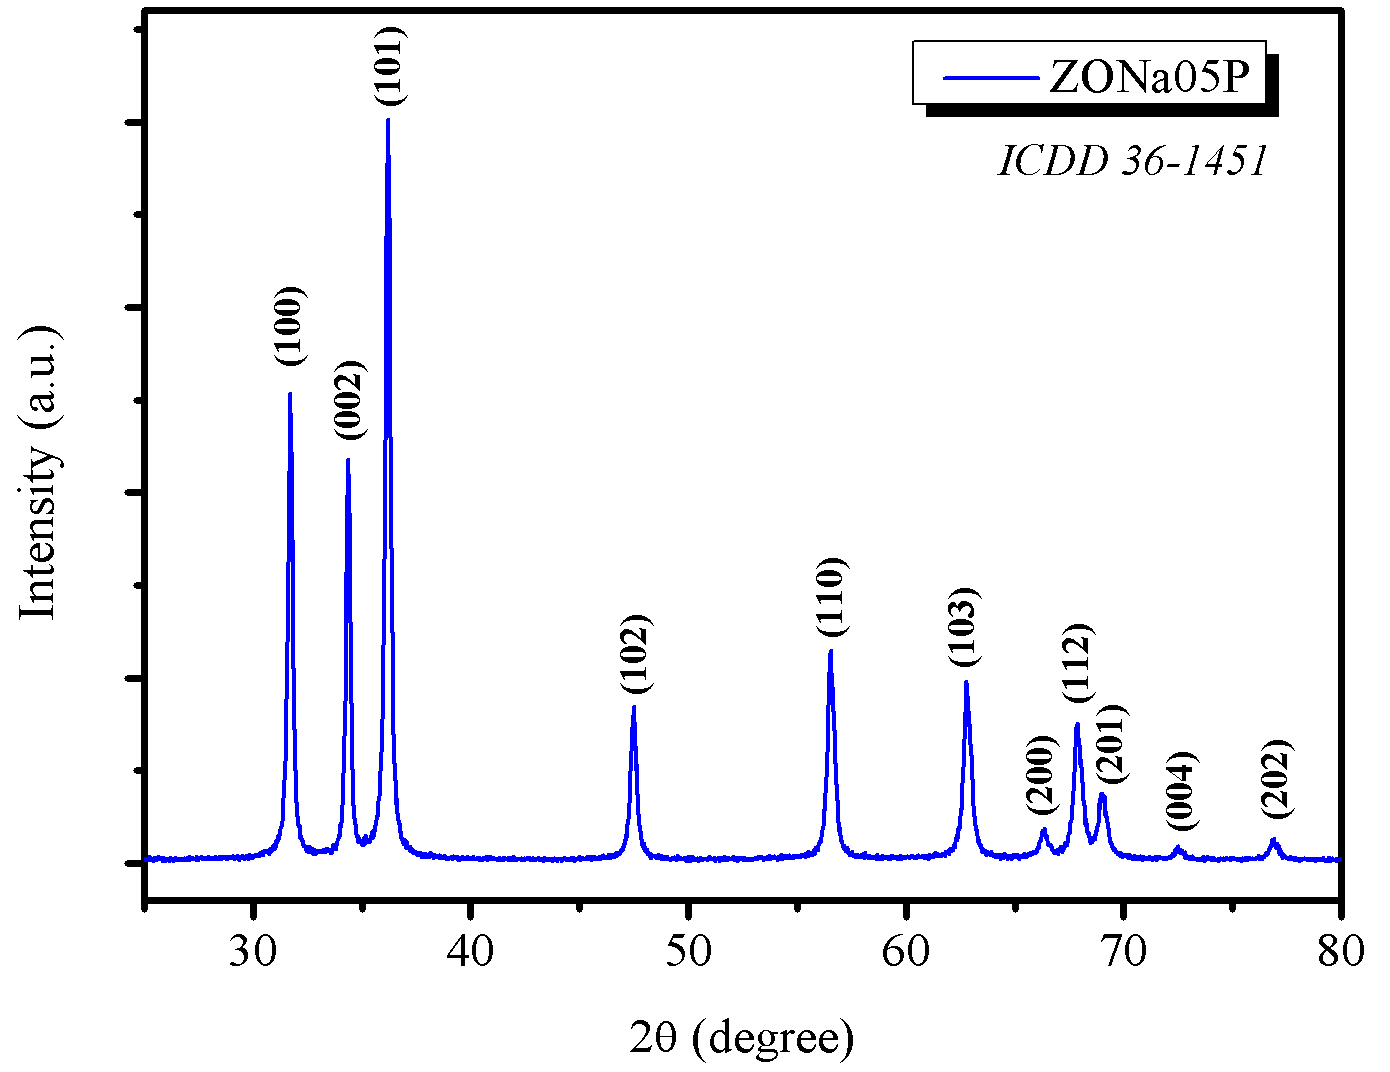 |  |
In Figure 3(a), the X-ray diffractogram showed the formation of ZnO with hexagonal phase (space group P\(63\)mc) with peaks consistent with the ICCD \(36-1451\) pattern. Furthermore, long-range secondary phase formation was not observed. Lattice parameters were calculated using the Rede\(93\) software developed by UNESP, Araraquara, Brazil. These parameters for the ZONa05P sample were \(a = 3.251 \text{ and } c = 5.207\). These values are consistent with the reference parameter values \(a = 3.249 \text{ and } c = 5.206\) shown on the ICDD card.
Chankhanittha & Nanan, 2018 synthesized ZnO by the conventional hydrothermal method (without microwave irradiation) using NaOH as a mineralizing agent and obtained a material with long-range crystallite size (\(\text{D}_\text{XRD}\)) ranging from \(46-51\) nm. It is worth noting that they did not use PEG and that the synthesis time was \(24\) h. In the present work, the synthesis of ZnO occurred in just \(5\) minutes with a crystallite size of \(34.9\) nm. These data indicate that the introduction of PEG and irradiation by microwave waves enabled the formation of a material with high crystallinity, of nanometric order, in a short synthesis time. Analysis of the SEM image, as depicted in Figure 3(b), showed that ZONa05P presented lamellar clusters, resulting in an almost spherical shape, with dimensions less than \(5~\mu\text{m}\).
Figure 4 shows the nitrogen adsorption-desorption isotherms of the ZONa05P sample.
| (a) | (b) |
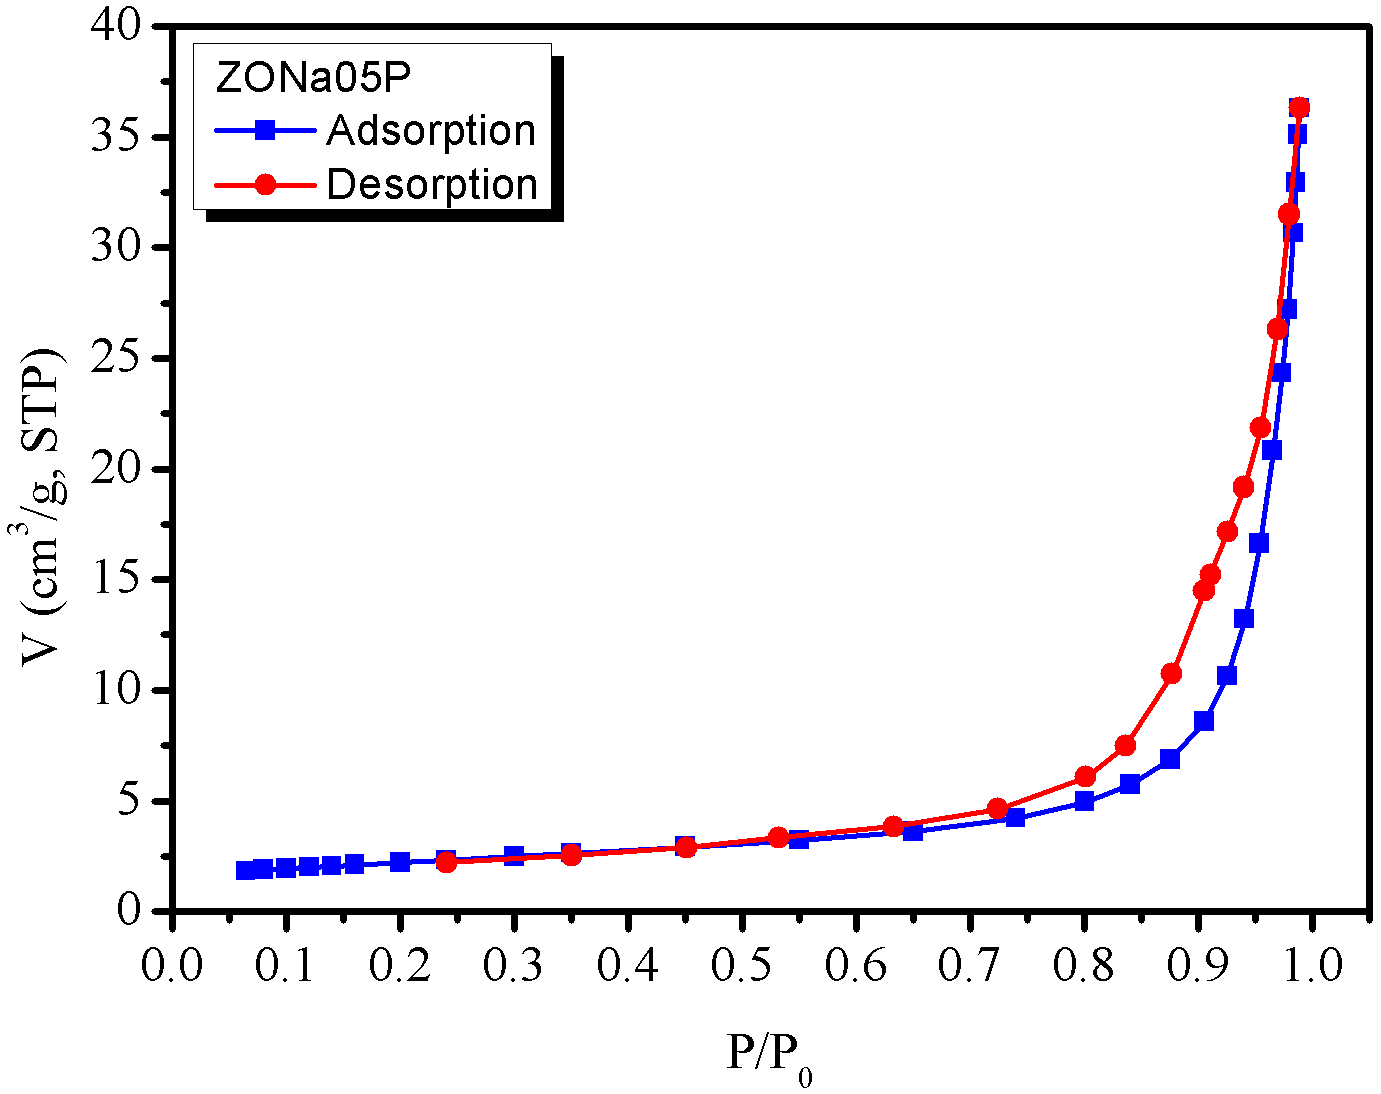 | 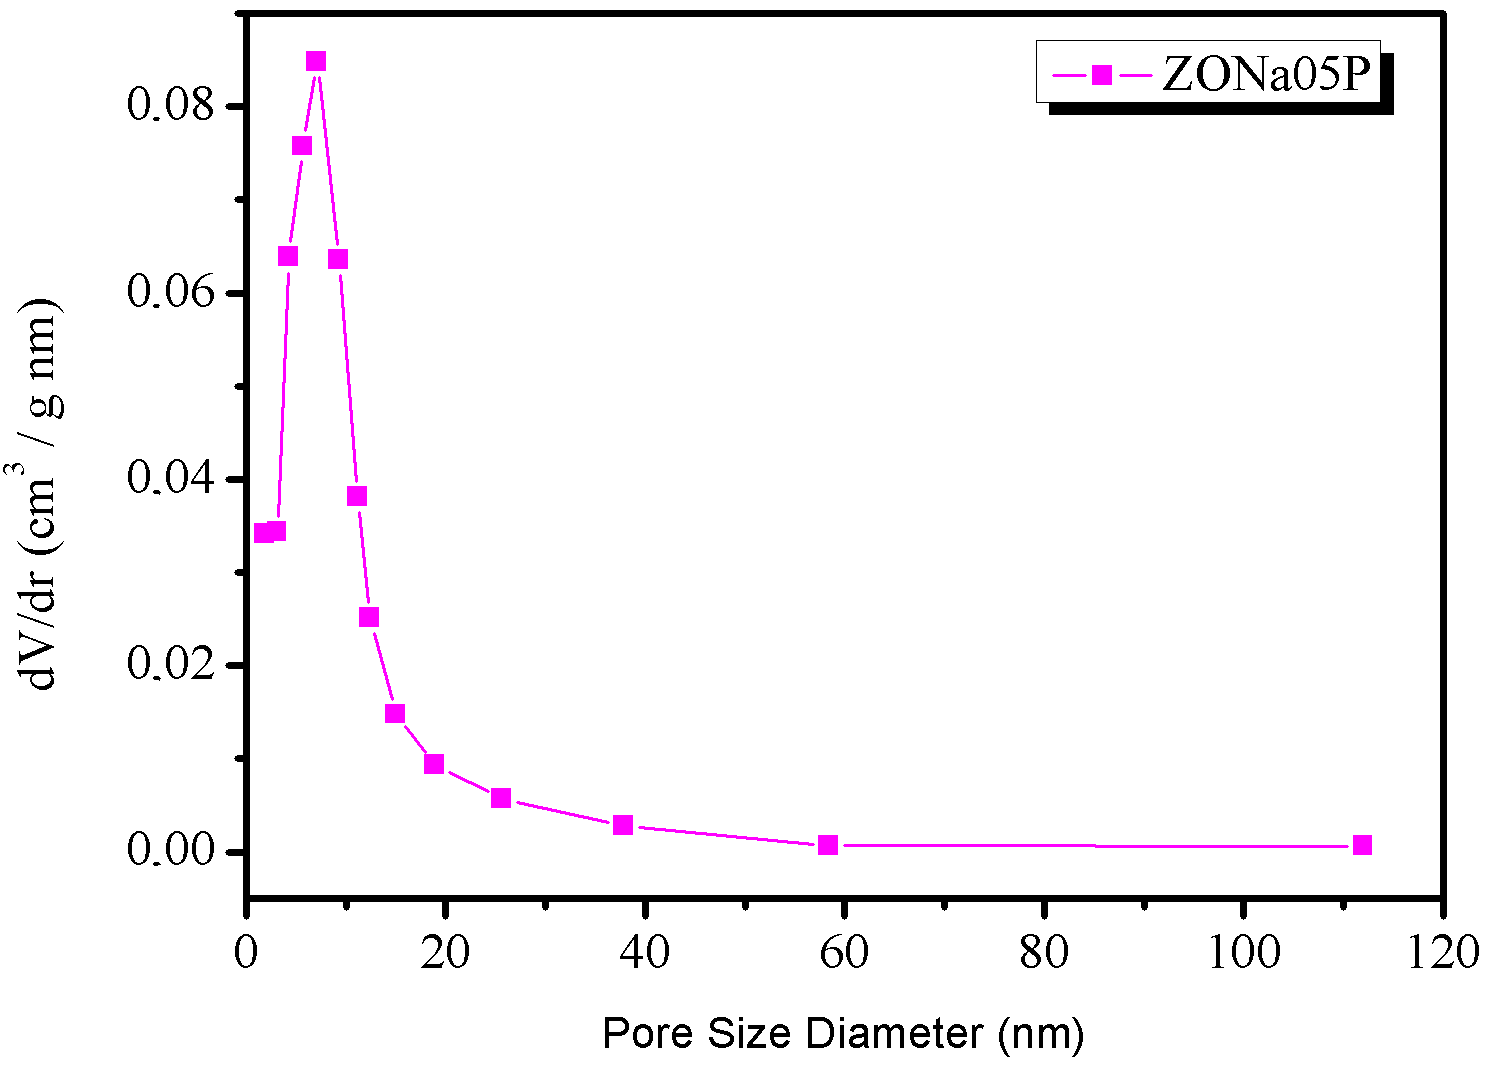 |
The \(\text{N}_2\) adsorption and desorption isotherms, shown in Figure 4(a), indicated that the material ZONa05P is of the H-3 loop type, according to the IUPAC classification (Sing et al., 1985), which is typical of N\(_2\) aggregates with slit pores. The data showed that the material has a specific surface area of \(7.64 \text{m}^2\text{.g}^{-1}\). Regarding the pore size distribution (BJH method applied to the desorption isotherm), Figure 4(b), the average pore size was observed to be around \(15\) nm, although the largest pore population varied from \(7\) to 1\(5\) nm.
Photodegradation of RNL and the effect of the initial concentration (\(C_0\))
The effect of the initial concentration (\(C_0\)) study of the azo dye on photocatalytic degradation was carried out by varying the concentration of the RNL solution from 0.01 to \(0.09\text{ mmol.L}^{-1}\)). In this study, the mass of ZONa05P was set at 10 mg, pH 6.0, solution volume of 10 mL and irradiation time of 80 min. Removal rates (R %) are shown in Figure 5.

The data showed that at low concentrations (\(0.01\text{ mmol.L}^{-1}\) and \(0.03\text{ mmol.L}^{-1}\)) the highest removal rate occurred, \(91\) % and \(92\) %, respectively. As the concentration of the azo dye increases, there is a tendency for the R % to decrease. Similar results were observed by Kaur et al., 2013 at the photodegradation of methyl orange azo dye by ZnO particles. This phenomenon may occur due to saturation of the photocatalyst, since a greater quantity of azo dye molecules adsorb at the surface competing for the material active sites. Furthermore, as the removal rate is associated with the number of electron/hole pairs (\(\text{e}^-/\text{h}^+\)) photogenerated, considering that the mass of the photocatalyst remained constant and that amount of hydroxyl radicals generated did not increase either, it was expected that the removal rate decreased with increasing azo dye concentration. Based on these results, it was decided to continue the study by setting the initial concentration of the RNL dye at \(0.03\text{ mmol.L}^{-1}\).
Effect of UVC radiation on the photocatalytic degradation of RNL
In order to understand the action of UVC lamp radiation on the dye photodegradation process, the initial conditions of RNL solution (\(0.03\text{ mmol.L}^{-1}\)), pH\(=\) 6.0 and the mass of ZONa05P (\(10\) mg). A sample of the dye solution without addition of ZONa05P was also submitted to radiation to evaluate the natural photolysis process. The UVC photoirradiation time totaled \(80\) min. In contrast, a sample was subjected to contact with ZnO nanoparticles in the absence of UVC irradiation (dark with ZONa05P) for \(80\) min.
Figure 6 shows the R % of the RNL dye due to photolysis in the presence and absence of ZONa05P and in the dark.

When evaluating the degradation of the dye in the absence of the catalyst (photolysis without ZONa05P) and with the catalyst in the absence of ultraviolet light (dark with ZONa05P), the percentages of degradation, for the same reaction time, were \(6\) % and \(13\) %, respectively. These results indicate that the removal process is favored (92 %) only when was submitted to irradiation.
This effect is only reached because, when ZONa05P is irradiated with a light source (\(h\upsilon\)) whose energy is equal to or greater than the band gap of the material, the electron (\(\text{e}^-\)) is promoted from the valence band (BV) to the conduction band (BC), resulting in the formation of \(\text{e}^-/\text{h}^+\) pairs as shown in equation (3):
(3)
\[ \text{ZONa05P} + h\upsilon \rightarrow h^+ + e^-.\]
As a consequence, \(\text{e}^-/\text{h}^+\) pairs give the semiconductor material redox properties, promoting the direct degradation of the dye molecules (Shen et al., 2015). This electron/hole pair can be rapidly recombined through surface material defects or interact with the acceptor (R) or donor molecule (D) adsorbed on the surface, as shown in equations (4) and (5):
\[\begin{aligned} \text{R}_\text{ads} + \text{e}_\text{BC}^- \rightarrow \text{R}_\text{ads}^- ; \label{4} \\ \text{D}_\text{ads} + \text{h}_\text{BV}^+ \rightarrow \text{D}_\text{ads}^+ . \label{5} \end{aligned}\]
Furthermore, electron/hole molecules of azo dye oxidation can occur due the formation of hydroxyl (⋅) or superoxide (\(\text{O}_2^{\bullet -}\)) radicals. This last chemical species (superoxide) can form peroxides (\(\text{H}_2\text{O}_2\)) as shown in equations (6) to (9):
\[\begin{aligned} \text{H}_2\text{O} + \text{h}^+ \rightarrow \text{H}^+ + \text{⋅ OH}; \label{6} \\ \text{OH}^- + \text{h}^+ \rightarrow \text{⋅ OH}; \label{7} \\ \text{e}^- + \text{O}_2^- \rightarrow \text{O}^{\bullet -}; \label{8} \\ \text{O}^{\bullet -}_2 + \text{HO}_2 + \text{H}^+ \rightarrow \text{H}_2\text{O}_2 + \text{O}_2. \label{9} \end{aligned}\]
Finally, these generated radicals react directly with the azo dye promoting the formation of inorganic compounds, CO\(_2\) and H\(_2\)O, equation (10) (Chen et al., 2017; Shen et al., 2015).
\[ {\text{O}^{\bullet -}_{2}/ \bullet\text{OH}} + \text{azo dye} \rightarrow \text{CO}_2 + \text{H}_2\text{O} + \text{inorganic molecules.}\]
Effect of mass
The effect of photocatalyst dosage on photodegradation of azo dye RNL was evaluate by varying the mass of ZONa05P by \(5\) mg, \(10\) mg, \(15\) mg and \(20\) mg. For this study, the \(C_0\) of the azo dye was set at \(0.03\text{ mmol.L}^{-1}\), solution volume of \(10\) mL, pH \(6.0\) and irradiation time of \(80\) min. R % are shown in Figure 7.
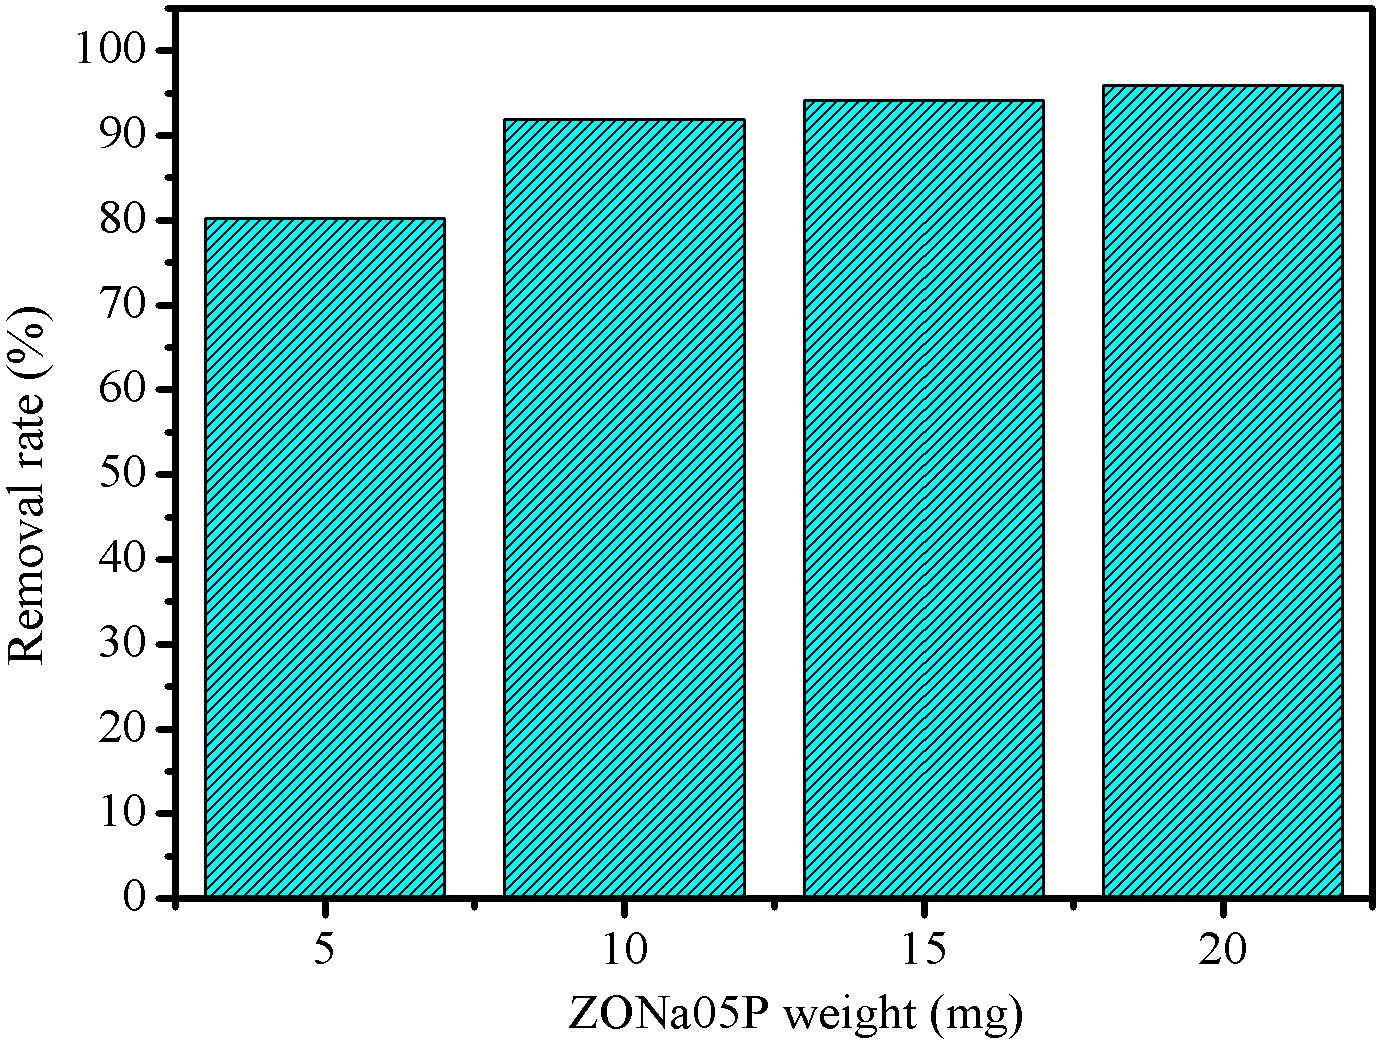
It was observed that \(5\) mg of ZONa05P photocatalyst promoted \(80~\\) degradation of the azo dye. When doubling the amount of ZONa05P the degradation was \(92~\\), which corresponded to an increase of \(12\) percentage points. For samples containing \(15\) mg and \(20\) mg, the degradation percentages were close to \(96~\\). When comparing the percentages of degradation between \(10\) mg and \(20\) mg, the increase was only \(3\) percentage points. These results indicate that, for these reaction conditions, the dosage of material greater than \(10\) mg does not promote significant changes in the photodegradation process. As the increase of photocatalyst amount promotes an increase in the turbidity of the solution, this provides a lower penetration of UV radiation due to increased light scattering.
Effect of pH
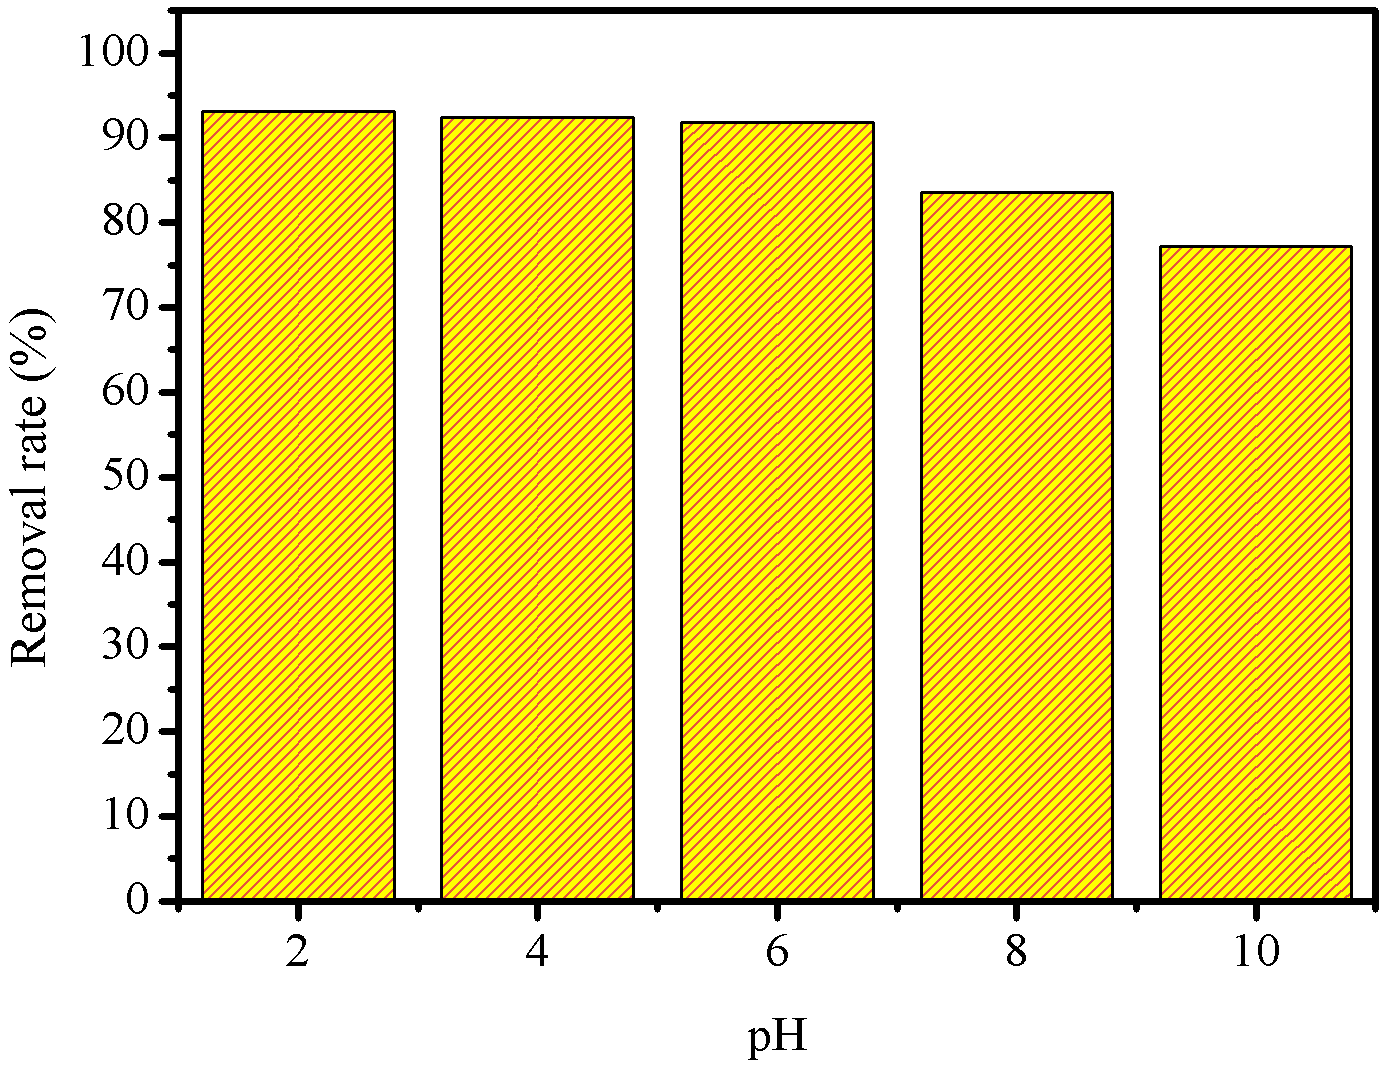
Figure 8 shows the R % by ZONa05P, in different initial pH conditions, and the pH value of the zero charge potential (\(\text{pH}_\text{PCZ}\)) of ZONa05P, obtained according to the methodology described by Jaime O Robles & John R. Regalbuto, 2004. For this study, the \(C_0\) of the azo dye was fixed at \(0.03\text{ mmol.L}^{-1}\), a solution volume of \(10\) mL, \(10\) mg of photocatalyst mass and an \(80\) min of irradiation time.
The pH of azo dye solution to be degraded through heterogeneous catalysis is a key parameter in the photocatalysis process. Typically, industrial effluents containing azo dyes have a wide pH range. In Figure 8 (a) it was observed that ZONa05P presented a percentage degradation between \(77~\\) and \(93~\\), in the pH range evaluated. The removal rate of the azo dye RNL showed a small increase at acidic pH when compared to the solution at natural pH (pH = \(6.0\)). However, at alkaline pH, there is a decrease in the rate of degradation. Similar results have been reported in the literature for other azo dyes (Chen et al., 2017; Paz et al., 2014; Thomas et al., 2016). This phenomenon can be attributed to the charge density acquired on the photocatalyst surface.
| (a) | (b) |
 | 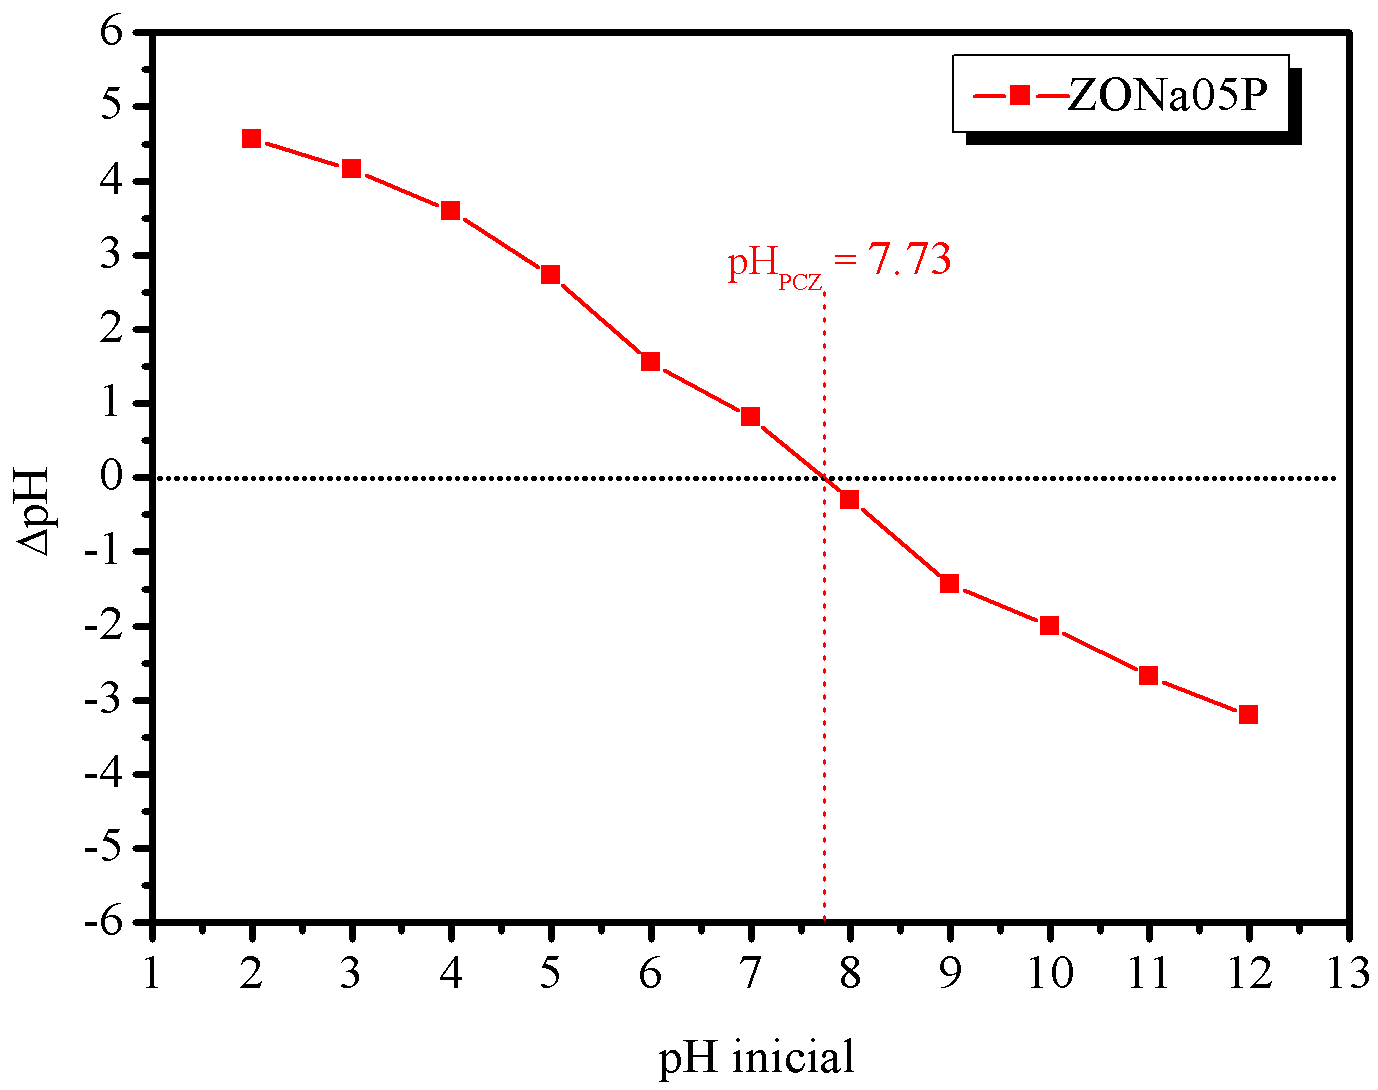 |
According to the graph, of initial pH vs \(\Delta\)pH, shown in Figure 8(b), the point at which the \(\Delta\)pH value is zero corresponds to the zero charge potential (PCZ), indicating how positive or negative the surface of the material is (Mahmood et al., 2011). Thus, it was observed that the ZONa05P sample presented \(\text{pH}_\text{PCZ} = 7.73\). In general, when the pH solution is lower than the \(\text{pH}_\text{PCZ}\) value, the surface of the material acquires a positive charge density, favoring the adsorption of anions, while at a pH higher than the \(\text{pH}_\text{PCZ}\) the surface becomes negatively charged, thus favoring the cation adsorption (Zhu et al., 2012).
The literature indicates that the RNL dye has three p\(K_a\) values: \(3\), \(3.5\) and \(6\). The first value corresponds to the deprotonation of the sulfonic group, the second refers to the sulfate group and the third to the amide group (Lucena et al., 2017; Teixeira et al., 2012), whereas this complete deprotonation only occurs at pH greater than \(6\), leading to a greater tendency for negative charges. Thus, the forces of attraction between the ZONa05P surface charges and the negative groups of the azo dye are stronger when the pH of the solution is lower than \(\text{pH}_\text{PCZ}\). This justify the photodegradation behavior with higher percentages at acidic pH, as observed in Figure 8(a). Furthermore, in acidic pH, a large O\(_2\) amount of may have been reduced to \(\text{O}^{\bullet -}\), as the positively charged surface of ZONa05P is conducive to photoelectron transfers to the photocatalyst surface (Chen et al., 2017).
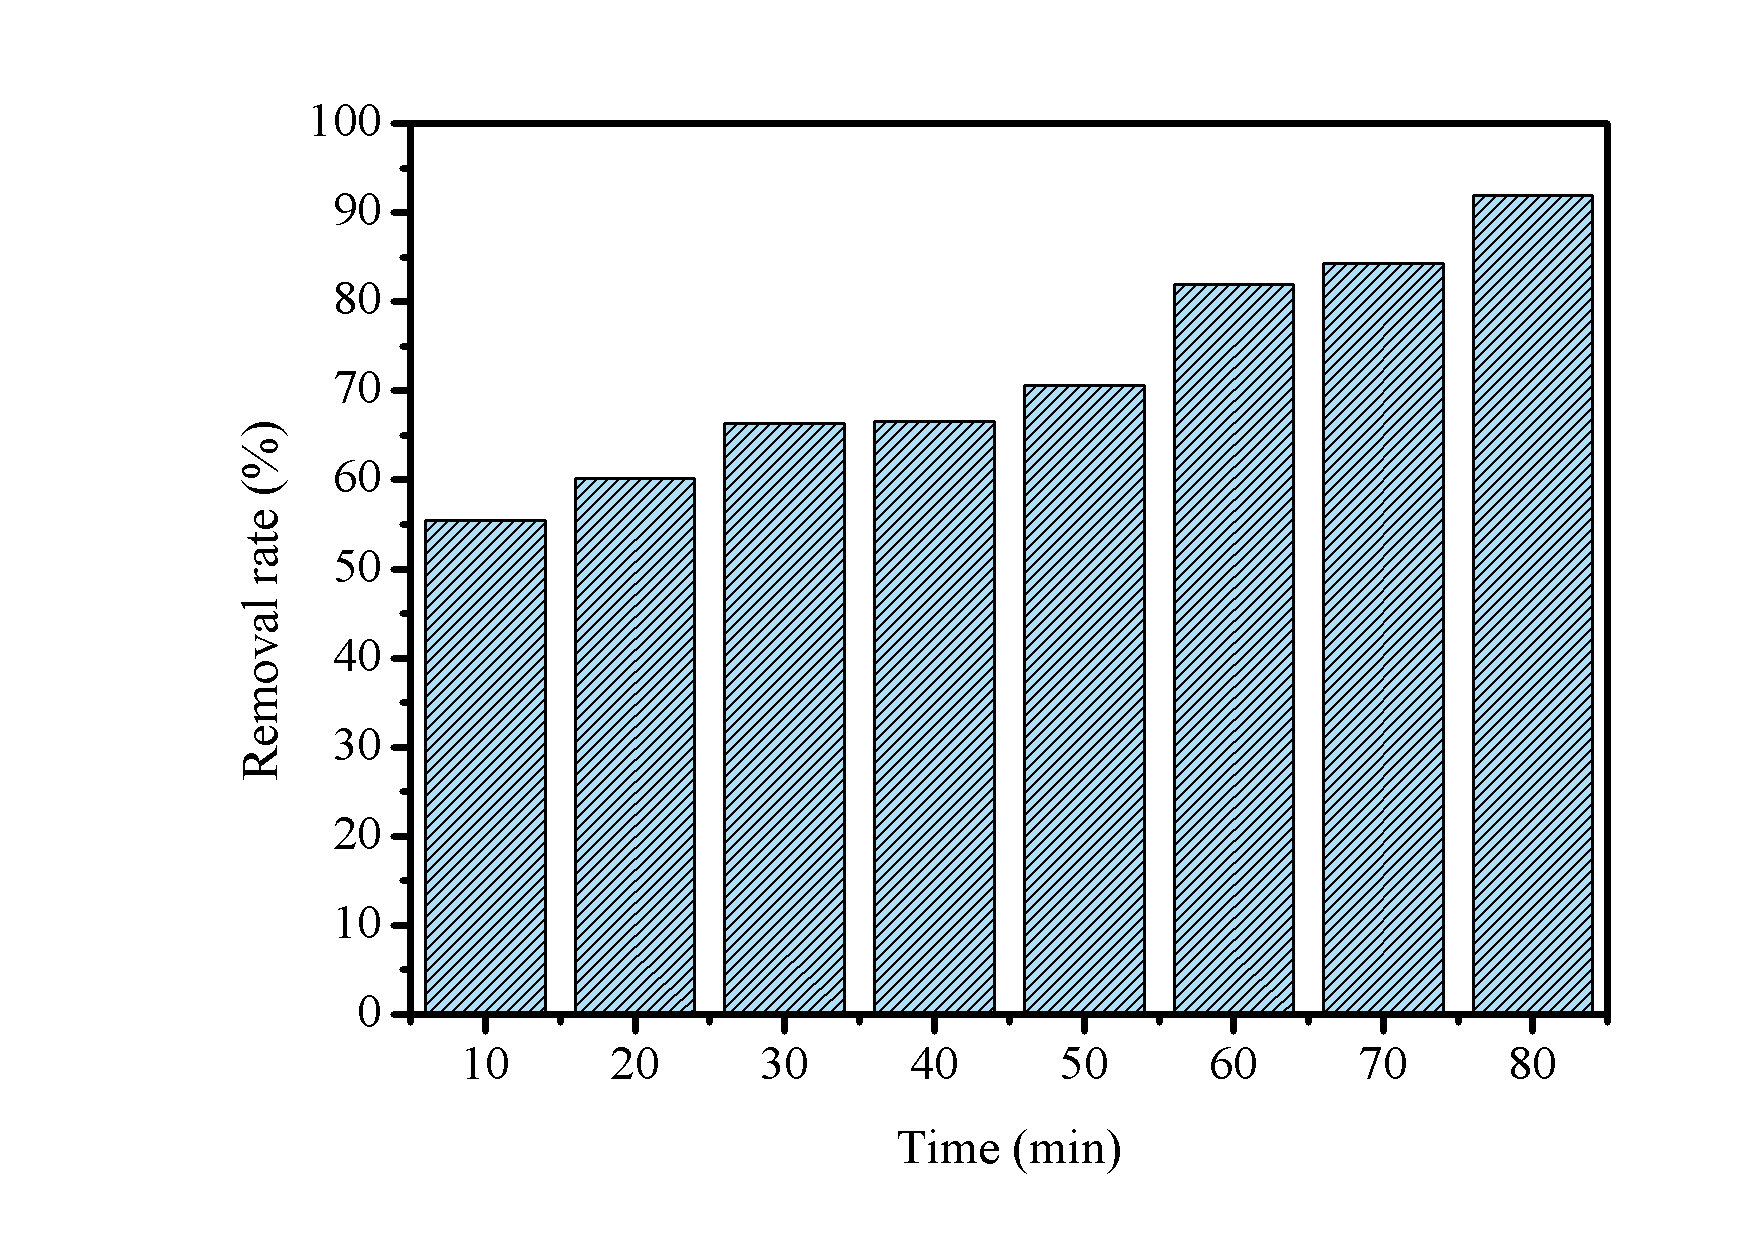
Removal Kinetics
The influence of contact time on photodegradation is presented in Figure 9. The data showed that with \(10\) min of UVC irradiation the R % reached \(55\) % and that there is a tendency for growth as time increases, with the percentage maximum obtained at \(80\) min. Furthermore, it was noticed that between \(30-40\) min there were no significant changes and that between \(60-70\) min there was a small increase of \(2~\\).
Based on the data obtained in this study, an evaluation of the photodegradation kinetics of the azo dye RNL was carried out using the pseudo-first order linearized model, described by equation (11),
\[ \ln{\left(\frac{C_0}{C_f}\right)} = K_\text{app}\cdot t,\]
where: \(K_\text{app}\) is the degradation rate constant (\(\text{min}^{-1}\)); \(C_0\) and \(C_f\) are the initial and final concentrations of the dye (\(\text{mmol.L}^{-1}\)) before and after the photocatalysis process, respectively, and \(t\) is the irradiation time (min).
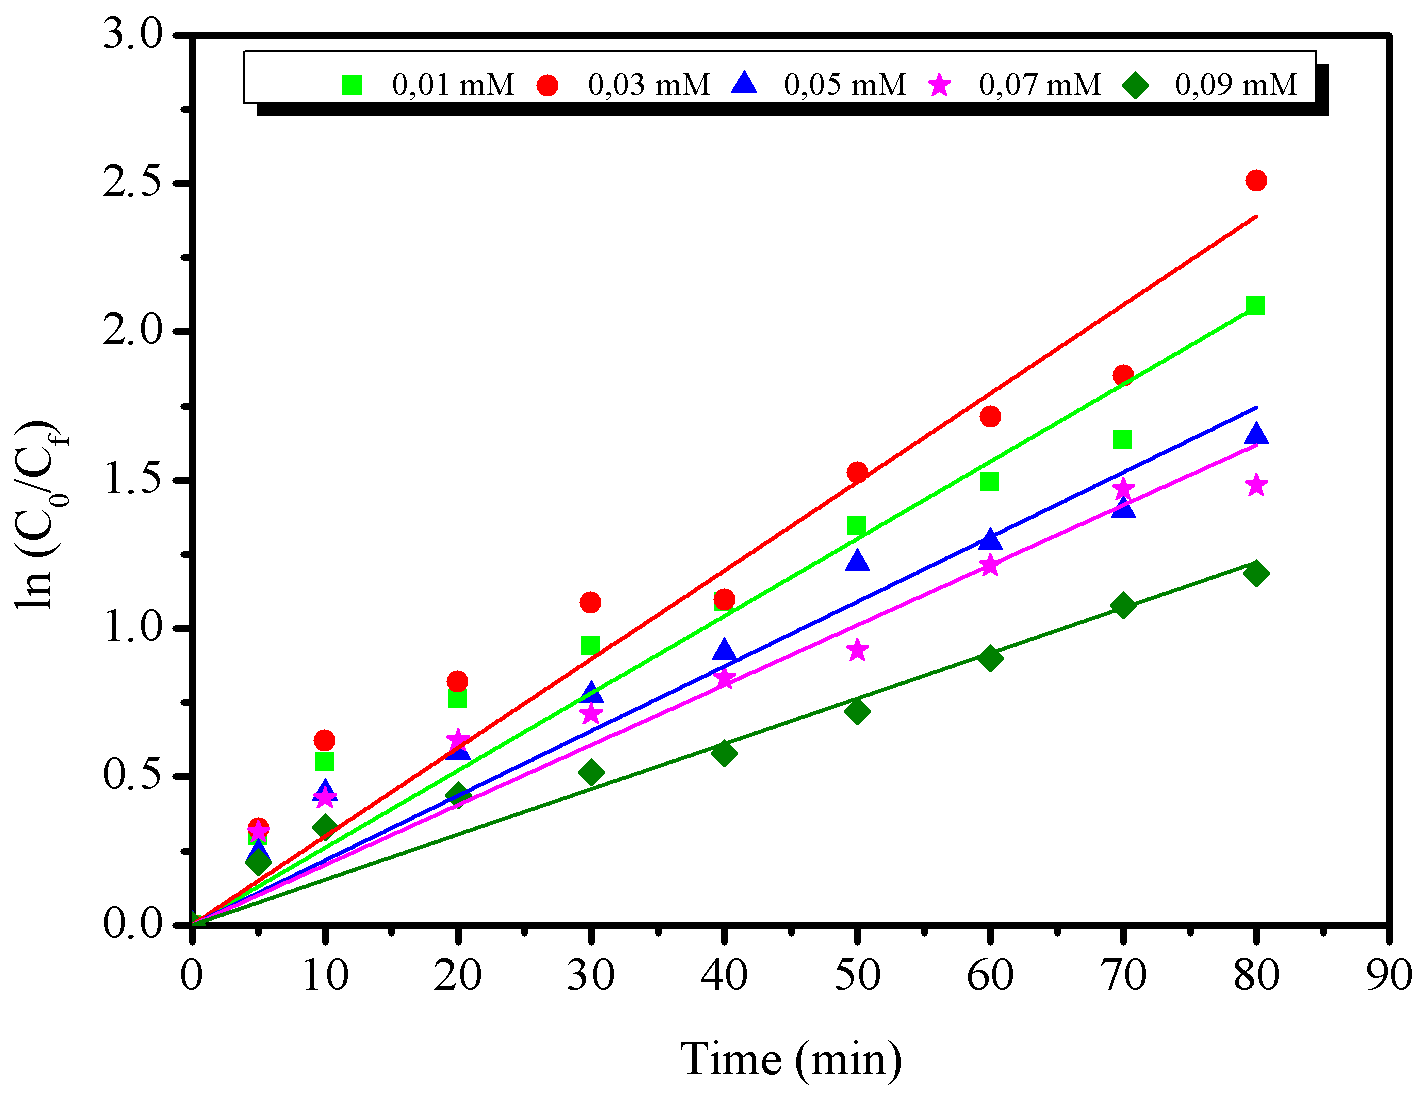
For the kinetic study, the initial concentration of the azo dye RNL varied from \(0.01\) mM to \(0.09\) mM. The results are shown in Figure 10 and the correlation coefficients (R\(^2\)) are shown in Table 1.
| (a) | (b) |
 |  |
| \(C_0~(\text{mmol.L}^{-1})\) | R % | \(K_\text{app}~(\text{min}^{-1})\) | R\(^2\) |
|---|---|---|---|
| \(0.01\) | \(91\) | \(2.604\times10^2\) | \(0.98108\) |
| \(0.03\) | \(92\) | \(2.987\times10^2\) | \(0.98152\) |
| \(0.05\) | \(76\) | \(2.180\times10^2\) | \(0.98313\) |
| \(0.07\) | \(77\) | \(2.023\times10^2\) | \(0.97617\) |
| \(0.09\) | \(70\) | \(1.528\times10^2\) | \(0.98283\) |
Considering the equations of the straight lines obtained from Figure 10(a), the values of the correlation coefficients (R\(^2\)) indicated that the photodegradation of the azo dye fits the pseudo-first order kinetic model. Among all the concentrations tested, \(C_0 = 0.03\text{ mmol.L}^{-1}\) was the one with the highest \(K_\text{app}\) value (\(2.987\times10^{-2}\)). Furthermore, it was observed that as the dye concentration increased, the degradation rate constant decreased, except the concentration range \(0.01-0.03\text{ mmol.L}^{-1}\). Similar results were reported by Kaur et al., 2013 when evaluating the photodegradation of methyl orange azo dye by ZnO particles synthesized by the oxalate precursor thermal decomposition method.
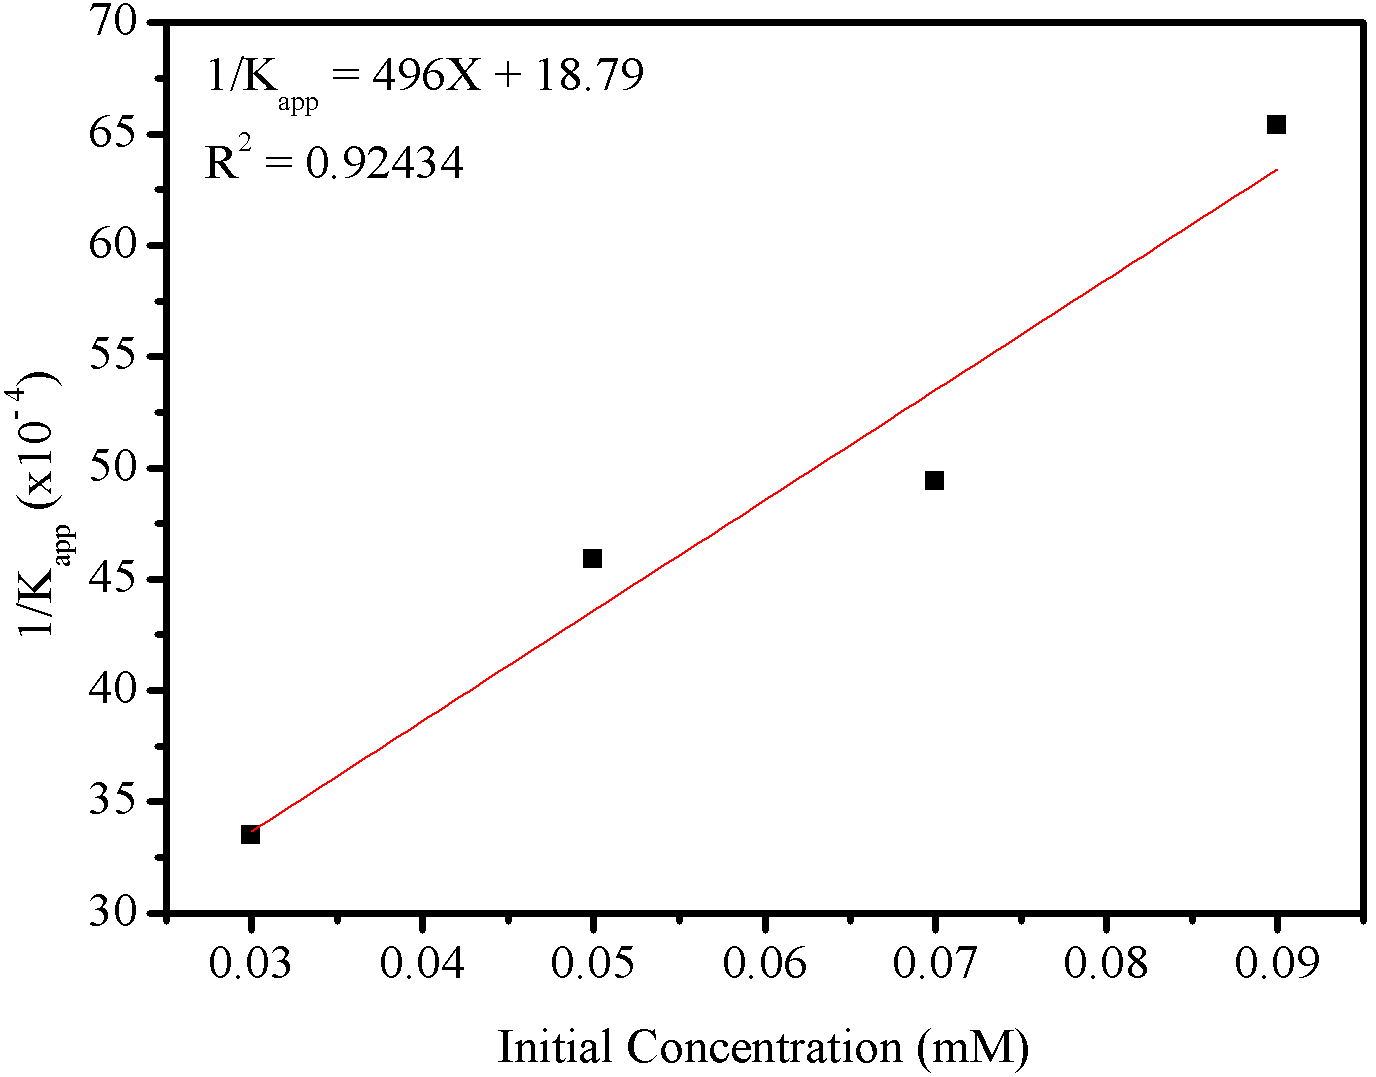
To describe the photocatalysis processes of organic dyes in aqueous solutions, several researchers have used the Langmuir-Hinshelwood (L-H) kinetic model to explain the solid-liquid interface processes (Barka et al., 2010; Ertugay & Acar, 2017) according to equation (12),
\[ \frac{1}{K_\text{app}} = \frac{1}{K_1K_2} + \frac{C_0}{K_1},\]
where: \(K_\text{app}\) is the degradation rate constant (min\(^{-1}\)); \(K_1 (\text{mol.L}^{-1}\text{.min}^{-1})\) is the surface reaction rate constant; \(K_2(\text{L.mol}^{-1})\) is the Langmuir-Hinshelwood adsorption equilibrium constant and \(C_0\) is the initial concentration (\(\text{mol.L}^{-1}\)) of the azo dye.
The L-H mechanism postulates that the solid-catalyzed reaction in the liquid phase occurs between species adsorbed on the material surface active sites. Thus, the photocatalyst increases the reaction rate through the ability to adsorb reactants so that the activation energy is significantly reduced relative to the same reaction without the photocatalyst (Hougen & Watson, 1943).
According to the data presented in Figure 10(b) and Table 1, a linear relationship between the data (R\(^2 = 0.92527\)) was verified, indicating that the photodegradation process of the azo dye RNL by ZONa05P can be validated by the model L-H. The values of \(K_1\) and \(K_2\) were calculated using the straight line equation (12) and the values obtained were \(2.01\times10^{-6}\text{ mol.L}^{-1}\text{.min}^{-1}\text{ and }2.66\times10^4\text{ L.mol}^{-1}\), respectively.
Conclusions
XRD patterns and SEM image results showed that ZnO synthesis resulted in the formation of a hexagonal structure with an almost spherical morphology. The catalyst dimensions were below \(5~\mu\)m and an average crystallite size of \(34.9\) nm. ZONa05P showed high photocatalytic efficiency in the azo dye RNL degradation with UV radiation, reaching 92 % discoloration after 80 min of reaction. The pseudo-first order kinetic model and the mechanism proposed by the Langmuir-Hinshelwood (\(\mathrm{L-H}\)) model fit for this the degradation data. The acidic condition is more favorable to photodegradation than the alkaline condition. The azo dye removal rate decreases with increasing initial dye solution concentration and increases slightly with increasing photocatalyst mass.
Acknowledgements
The authors would like to thank NPE-LACOM/UFPB for carrying out the X-ray diffraction analyses, CETENE for the SEM images and PIBIC/CNPq/UFPB for Scholarship support.
Conflicts of interest
The authors certify that there is not a commercial or associative interest that represents conflict of interest in relation to the manuscript.
Author contributions
G.L. Lucena participated in conceptualization, formal analysis, investigation, visualization and writing – original draft, review and editing. R.J.C. Araújo participated in conceptualization, formal analysis, investigation, visualization and writing – original draft; visualization, validation and writing - review and editing. R.P. Silva participated in formal analysis, investigation, visualization, validation and writing - original draft, review and editing. A.M. Melo participated in visualization, validation and writing. M.R. Quirino participated in visualization, validation and writing.
References
Alfarisa, S., Toruan, P. L., Dwandaru, W. S. B., Hudha, M. N. & Sumarlan, I. (2019). {Microwave-assisted hydrothermal growth of ZnO micro-nano structures. 1-6. https://doi.org/10.1088/1742-6596/1375/1/012062
Alsantali, R. I., Raja, Q. A., Alzahrani, A. Y. A., Sadiq, A., Naeem, N., Mughal, E. U., Al-Rooqi, M. A., Guesmi, N. E., Moussa, Z. & Ahmed, S. A. (2022). {Miscellaneous azo dyes: a comprehensive review on recent advancements in biological and industrial applications. 1-47. https://doi.org/10.1016/j.dyepig.2021.110050
Alzain, H., Kalimugogo, V., Hussein, K. & Karkadan, M. (2023). {A review of environmental impact of azo dyes. 10(6), 673-689. https://doi.org/10.52403/ijrr.20230682
Ansari, S. A., Khan, M. M., Ansari, M. O., Lee, J. & Cho, M. H. (2013). {Biogenic synthesis, photocatalytic, and photoelectrochemical performance of Ag-ZnO nanocomposite. 117(51), 27023-27030. https://doi.org/10.1021/jp410063p
Barka, N., Qourzal, S., Assabbane, A., Nounah, A. & Ichou, Y. A. (2010). {Photocatalytic degradation of an azo reactive dye, Reactive Yellow 84, in water using an industrial titanium dioxide coated media. 279-283. https://doi.org/10.1016/j.arabjc.2010.06.016
Benkhaya, S., M’rabet, S. & Harfi, A. E. (2020). {Classifications, properties, recent synthesis and applications of azo dyes. 6(1), 1-26. https://doi.org/10.1016/j.heliyon.2020.e03271
Carmen, Z. & Daniela, S. (2012). {Textile organic dyes–characteristics, polluting effects and separation/elimination procedures from industrial effluents–a critical overview. IntechOpen. 55-86. https://doi.org/10.5772/32373
Catanho, M., Malpass, G. R. P. & Motheo, A. J. (2006). {Evaluation of electrochemical and photoelectrochemical methods for the degradation of three textile dyes. 983–989. https://doi.org/10.1590/S0100-40422006000500018
Chankhanittha, T. & Nanan, S. (2018). {Hydrothermal synthesis, characterization and enhanced photocatalytic performance of ZnO toward degradation of organic azo dye. 79-82. https://doi.org/10.1016/j.matlet.2018.05.032
Chen, X., Wu, Z., Liu, D. & Gao, Z. (2017). {Preparation of ZnO photocatalyst for the efficient and rapid photocatalytic degradation of azo dyes. 143-152. https://doi.org/10.1186/s11671-017-1904-4
Chung, K. T. (2016). {Azo dyes and human health: A review. 34(4), 233–261. https://doi.org/10.1080/10590501.2016.1236602
Ertugay, N. & Acar, F. N. (2017). {Ultrasound and UV stimulated heterogeneous catalytic oxidation of an azo dye: A synergistic effect. 42(3), 235-243. https://doi.org/10.3184/146867817X14821527549095
Hasanpoor, M., Aliofkhazraei, M. & Delavari, H. (2015). {Microwave-assisted synthesis of zinc oxide nanoparticles. 320-325. https://doi.org/10.1016/j.mspro.2015.11.101
Hougen, O. A. & Watson, K. M. (1943). {Solid catalysis and reaction rates. 35(5), 529-541. https://doi.org/10.1021/ie50401a005
Kaur, J., Bansal, S. & Singhal, S. (2013). {Photocatalytic degradation of methyl orange using ZnO nanopowders synthesized via thermal decomposition of oxalate precursor method. 33-38. https://doi.org/10.1016/j.physb.2013.02.005
Komarneni, S., Roy, R. & Li, Q. H. (1992). {Microwave-hydrothermal synthesis of ceramic powders. 27(12), 1393-1405. https://doi.org/10.1016/0025-5408(92)90004-J
Lee, H. J., Kim. J. H., Park, S. S., Hong, S. S. & Lee, G. D. (2015). {Degradation kinetics for photocatalytic reaction of methyl orange over Al-doped ZnO nanoparticles. 199-206. https://doi.org/10.1016/j.jiec.2014.10.035
Lucena, G. L., Lima, L. C., Honório, L. M. C., Oliveira, A. L. M., Tranquilin, R. L., Longo, E., Souza, A. G., Maia, A. S. & Santos, I. M. G. (2017). {CaSnO3 obtained by modified Pechini method applied in the photocatalytic degradation of an azo dye. 536-541. https://doi.org/10.1590/0366-69132017633682190
Mahmood, T., Saddique, M. T., Naeem, A., Westerhoff, P., Mustafa, S. & Alum, A. (2011). {Comparison of different methods for the point of zero charge determination of NiO. 50(17), 10017-10023. https://doi.org/10.1021/ie200271d
Manikanika & Chopra, L. (2022). {Photocatalytic activity of zinc oxide for dye and drug degradation: A review. 1653-1656. https://doi.org/10.1016/j.matpr.2021.11.283
Paz, D. S., Dotto, G. L., Mazutti, M. A. & Foletto, E. L. (2014). {Adsorption kinetics of direct black 38 on nitrogen-doped TiO2. 16(4), 690-698. https://doi.org/10.30955/gnj.001411
Puvaneswari, N., Muthukrishnan, J. & Gunasekkaren, P. (2006). {Toxicity assessment and microbial degradation of azo dyes. 44(8), 618-626.
Quirino, M. R., Oliveira, M. J. C., Keyson, D., Lucena, G. L., Oliveira, J. B. L. & Gama, L. (2017). {Synthesis of zinc oxide by microwave hydrothermal method for application to transesterification of soybean oil (biodiesel). 24-30. https://doi.org/10.1016/j.matchemphys.2016.09.062
Regalbuto, J. R. & Rolbes, J. (2004). {The engineering of Pt/carbon catalyst preparation for application on proton exchange fuel cell membrane (PEFCM). \textnormal{[University of Illinois at Chicago].
Jaime O Robles & John R. Regalbuto (2004). \textit{{The Engineering of Pt/Carbon Catalyst Preparation for application on Proton Exchange Fuel Cell Membrane (PEFCM)..
Schimidt, R., Gonjal, J. P. & Morán, E. (2022). {Microwaves microwave-assisted hydrothermal synthesis of nanoparticles. CRC Press Taylor \& Francis Group. 561-570. https://doi.org/10.48550/arXiv.2203.02394
Shen, T., Wang, C., Sun, J., Jiang, C., Wang, X. & Li, X. (2015). {TiO2 modified abiotic-biotic process for the degradation of azo dye methyl orange. 58704-58712. https://doi.org/10.1039/C5RA06686G
Sing, K. S. W., Everett, D. H., Haul, R. A. W., Moscou, L., Pierotti, R. A., Rouquerol, J. & Siemieniewska, T. (1985). {Reporting physisorption data for gas/solid systems with special reference to the determination of surface area and porosity. 57(4), 603-619. https://doi.org/10.1351/pac198557040603
Sun, Y., Guo, H., Zhang, W., Zhou, T., Qiu, Y., Xu, K., Zhang, B. & Yang, H. (2016). {Synthesis and characterization of twinned flower--like ZnO structures grown by hydrothermal methods. 42(8), 9648-9652. https://doi.org/10.1016/j.ceramint.2016.03.051
Surbhi, Chakraborty, I. & Pandey, A. (2023). {A review article on application of ZnO-based nanocomposite materials in environmental remediation. https://doi.org/10.1016/j.matpr.2023.02.041
Teixeira, T. P. F., Pereira, S. I., Aquino, S. F. & Dias, A. (2012). {Calcined layered double hydroxides for decolorization of azo dye solutions: Equilibrium, kinetics, and recycling studies. 29(7), 685-692. https://doi.org/10.1089/ees.2011.0293
Thomas, M., Naikoo, G. A., Sheikh, M. U. D., Bano, M. & Khan, F. (2016). {Effective photocatalytic degradation of congo red dye using alginate/carboxymethyl cellulose/TiO2 nanocomposite hydrogel under direct sunlight irradiation. 33-43. https://doi.org/10.1016/j.jphotochem.2016.05.005
Uday, U. S. P., Bandyopadhyay, T. K. & Bhunia, B. (2016). {Bioremediation and detoxification technology for treatment of dye(s) from textile effluent. In E. P. A. Kumbasar, \& A. E. Körlü (Eds). \textit{Textile Wastewater Treatment. https://doi.org/10.5772/62309
Vaiano, V. & De Marco, I. (2023). {Removal of azo dyes from wastewater through heterogeneous photocatalysis and supercritical water oxidation. 10(4), 230. https://doi.org/10.3390/separations10040230
Weldegebrieal, G. K. (2020). {Synthesis method, antibacterial and photocatalytic activity of ZnO nanoparticles for azo dyes in wastewater treatment: A review. 1-29. https://doi.org/10.1016/j.inoche.2020.108140
Yassumoto, L., Monezi, N. M. & Takashima, K. (2009). {Descoloração de alguns azocorantes por processos de fotólise direta e H$_2$O$_2$/UV. 30(2), 117-124. https://doi.org/10.5433/1679-0375.2009v30n2p117
Zhu, H., Jiang, R., Fu, Y., Guan, Y., Yao, J., Xiao, L. & Zeng, G. (2012). {Effective photocatalytic decolorization of methyl orange utilizing TiO2/ZnO/chitosan nanocomposite films under simulated solar irradiation. 41-48. https://doi.org/10.1016/j.desal.2011.10.036