
Behavior of the DenStream Clustering Algorithm for Attack Detection in the Internet of Things
Tazima, G. K.; Zarpelão, B. B.
DOI 10.5433/1679-0375.2023.v44.48956
Citation Semin., Ciênc. Exatas Tecnol. 2023, v. 44: e48956
Abstract:
Multiple attack detection schemes based on supervised batch learning are presented in the literature as an alternative to improve Internet of Things (IoT) security. These schemes require benign and malicious traffic samples for training and are unable to easily adapt to changes in the analyzed data. In this work, we study how we can use DenStream, an unsupervised stream mining algorithm, to detect attacks in IoT networks. This type of algorithm does not require labeled examples and can learn incrementally, adapting to changes. We aim to investigate whether attacks can be detected by monitoring the behavior of DenStream’s clusters. The results showed that DenStream could provide indicators of attack occurrence in TCP, UDP, and ICMP traffic.
Keywords: stream mining, cyberattack detection, internet of things, cybersecurity
Introduction
Applying Internet of Things (IoT) technologies within the home context is becoming increasingly accessible and the impact on daily life is undeniable. Through smart devices, these applications allow, for example, task automation, safety conditions improvement, and health monitoring. Unfortunately, alongside the multiple benefits, these devices also come associated with cybersecurity risks. The end user of residential solutions usually does not understand how these devices operate on a technical level and what kind of sensitive information they could trnasmit. Furthermore, given the low level of cybersecurity embedded in some of these devices and the fact that home automation solutions tend to be highly available, home automation devices become an attractive target for some types of attacks (Chow, 2017; Yangetal., 2018).
Security controls for computer networks are not new. However, in the context of IoT, there are some considerations mustbe made. IoT networks are made of devices with low computational power. With limited computational power, traditional network security controls do not work properly. In addition, these networks are populated with devices from different vendors, with diverse protocols and embedded security controls, if any. Finally, within the household context, end users rarely posses any knowledge to deal with configurations and analysis that could help improve security (Pishva, 2017; Anthi et al., 2019; Moustafa et al., 2019).
To tackle the plethora of threats effectively, implementing Intrusion Detection Systems (IDS) emerges as a viable security control option. Various proposed approaches for attack detection documented in the literature rely on batch machine learning algorithms. Typically falling under supervised learning techniques’ umbrella, these algorithms require labeled samples of normal and malicious traffic for effective training results. However, expecting non-expert users living in residential environments to possess skills essential for supervising and retraining models when patterns change or novel threats appear would be unfair. Therefore, it becomes pivotal to explore methodologies aimed at detecting attacks in continuous data flows susceptible to behavioral transformations (Zarpelão et al., 2017; Anthi et al., 2019; Moustafa et al., 2019; Pishva, 2017; Zheng et al., 2018).
An alternative to batch learning algorithms is stream learning algorithms. The main difference is that these algorithms use incremental learning to update their models every time a new data point is processed, making the model more resilient to concept drift or novel threats. Stream learning algorithms, as in batch learning algorithms, can be either supervised or unsupervised. In the latter category, stream clustering algorithms can be cited. These could be a good alternative to detecting intrusion in IoT networks because they do not require labeled samples and adapt to concept drifts in real-time (Aggarwal et al., 2003; Gama, 2010).
DenStream to detect attacks in IoT network traffic. DenStream utilizes incremental learning to create and maintain its clustering model. For this reason, it may provide quicker responses to changes in behavior, showing enhanced adaptability as it continuously refines its model. Additionally, the algorithm is not require to store historic observations, which is important becausethis study considers scenarios with restrictions regarding storage.
Algorithms like DenStream are focused on grouping observations according to their similarity, implying that they do not indicate which ones would be benign and malicious. Therefore, a challenge in using DenStream to detect attacks is to identify which characteristics of the clusters produced by it may indicate that an attack is taking place. The main hypothesis of the work is that monitoring the distance between micro-clusters can provide indicators that attacks are occurring. To this end, an experiment will be carried out in which, first, the network traffic of each IoT device is organized into three flows: TCP, UDP, and ICMP. Then, an instance of DenStream will be applied to each of these three types of flows, processing the traffic packet by packet. A public dataset containing network traffic from domestic IoT devices will be used.
This work is organized as follows: Related Work presents other studies on attack detection in IoT and discusses them from the perspective of this study. Stream clustering gives a brief description of this area and the DenStream algorithm. In Material and methods, the proposed experiment is presented in detail. Results details the study’s outcome, while Conclusions wraps up the paper with some final remarks.
Related work
With the growth of IoT, the concern about the security and privacy of users and systems has been also building up. In recent years, several studies have been developed and many focused on the development of intrusion detection techniques. As discussed earlier, in this study we propose to use a stream clustering algorithm to group similar data points and look for indicators that may point to an attack. In this section, studies that have convergence with the object of this work will be discussed.
Lohiya and Thakkar, 2020 present an extensive study on the prospects of IDS in IoT using machine learning and deep learning. In their paper, the authors discuss the advantages and disadvantages of different deployment strategies (centralized, distributed, and hybrid) of IDS for IoT networks, detection strategies (anomaly-based and signature-based), attack types in IoT networks, and attack detection techniques in IoT (machine learning and deep learning). Lohiya and Thakkar conclude their paper by pointing out some concerns and suggesting some directions for future work that proposes to contribute to the development of IDS for IoT.
In their study, Anthi et al., 2019 proposed an IDS for home IoT devices. The architecture proposed by Anthi et al. starts with pre-processing. In this step, the main features are selected to perform the classification accurately. After the pre-processing step, the packets go through three other steps. In the first one, a supervised machine learning (ML) algorithm is used to identify the device that is generating or receiving the traffic. In this step, each IoT device is evaluated, and a profile of its behavior is created. In the next step, another supervised ML algorithm decides whether the traffic coming from the device is benign or malicious. If the packet is classified as malicious in this step, a third algorithm comes into play and tries to identify the type of attack.
Also exploring DenStream, Scaranti et al., (2022) propose an IDS for a Software Defined Network (SDN) environment. First, the traffic is organized into flows, identified by source address, destination address, source ports, and destination ports. Then, the flow features are passed to the detector, which uses the DenStream clustering algorithm in its kernel and, finally, the types of attacks are identified.
Applying stream clustering techniques in a similar scenario, Nakagawa et al., (2021) propose the use of the CluStream algorithm for clustering network traffic packets and applying the Page-Hinkley test to detect abrupt changes in the monitored value series. Unlike DenStream, CluStream requires the specification of the maximum number of micro-clusters that will be maintained in the maintenance phase. In their work, Nakagawa et al. suggest monitoring the distance between the centroids of the micro-clusters to detect the incidence of attacks. Using the proposed method, they obtained an average detection rate of 92% with an average accuracy of 81%.
Yin et al., (2018) proposed a new clustering algorithm for data streams to be applied to the intrusion detection problem. The proposed algorithm is a variation of existing algorithms in the literature, such as DenStream itself, and focuses on clustering the observations according to their density in the search space and on establishing weight for the analyzed observations, which decreases With age. To detect attacks, the authors divided the problem into two phases. In the first case, network traffic is clustered to define normal behavior profiles, i.e., this traffic must not contain malicious packets. Then, the second phase consists of clustering the traffic and comparing the result of this process with what was found in the first phase. In the event of a discrepancy, an attack detection alert is issued. The normal behavior profiles are updated frequently so that the system can adapt to changes in the data. The experiments showed good results but used a rather outdated dataset, KDDCup 1999.
The analysis of the related work shows that the use of batch supervised learning is still quite present, as we can see in the works of Anthi et al., 2019 and Lohiya and Thakkar, 2020. Studies that relied on stream data mining are also found, but they have some differences concerning this work. Scaranti et al., (2022) also used DenStream, but analyzed IP flows, instead of traffic packets, in a different environment: SDNs. Yin et al., (2018) focused their efforts on building a new clustering algorithm, but did not clearly define which type of network or traffic they were going to address. Nakagawa et al., (2021) focused on IoT networks but used a different clustering algorithm to the one applied in this work.
Overall, most of the reviewed works proposed different algorithms or focused on different scenarios. Batch learning algorithms have a low update frequency and require large data volumes for training, which is not ideal in home network environments. Also, the reviewed studies that shared more similarities with this one in terms of algorithm choices either did not include packet-to-packet analyses, or were not applied in home IoT environments. In this work, we explore a detection model based on the stream clustering algorithm DenStream. This approach does not require to store observations since the chosen algorithm learns incrementally, and it is focused on packet-by-packet analyses of home IoT network devices.
Stream clustering
In batch learning algorithms, training to induce a learning model is carried out on a predefined set of data. In other words, a portion of the data is separated, and the algorithm is applied to it to create a model that represents that static data set. The data can be reused several times in the learning process and usually generate highly accurate learning models. To update the learning model, one cannot just present the new observations to the algorithm; in batch learning, the update is only valid when the entire batch has been processed. In other words, for scenarios that require a rapid response to changes, such as the one in this study, it would not be interesting to work with this premise (Gama & Rodrigues, 2007.
Scenarios such as big data, smart cities, healthcare, and IoT network monitoring, as is the case in this work, need faster responses to changes in behavior Muthukrishnan, 2005).
In stream mining applications, we cannot define a start and end point for the data flow. If we look at the traffic packets of a network device, the potential size of this series of values is infinite. As long as the device is on, new packets will be generated and this will only cease when the equipment is turned off or interrupted.
The behavior of a data stream is unpredictable and tends to change over time. Such problems, it is interesting to use learning models that can be updated and modified incrementally. This work, for example, studies IoT network traffic in a smart home environment. The behavior of network devices installed in a home can change over time, and it is unreasonable to expect an operator to update the learning model to incorporate this new behavior (Gama & Rodrigues, 2007; Muthukrishnan, 2005).
In clustering problems, the goal is to group the available data points into clusters according to the similarity between them. For example, when monitoring a computer network, we might assume each packet is a data point and choose some fields from the headers to analyze, such as packet size, source and destination port and TTL (time to live). In this case, the clustering algorithm would seek to assign to the same cluster packets that have similar sizes, ports and TTL. Still taking into account the example of a computer network, suppose that a new service has been installed in it, and, therefore, there will be packets with port numbers and sizes that were not previously observed. This indicates that the clusters that have been defined so far do not match these new packets. It would be necessary to run the clustering algorithm again so that the clusters are created considering this new behavior. This situation is frequent when data streams, such as network traffic, are mined. To address the particularities of network traffic, the clustering algorithm must meet the following requirements:
Do not assume the initial number of clusters.
Discover clusters with arbitrary shape.
Be capable of handling outliers.
Create, remove and merge clusters in real time.
DenStream is a data stream clustering algorithm proposed by Cao et al., (2006) that meets these requirements. Some highlights of DenStream:
DenStream stores statistical representations of clusters, rather than storing the data points that form the cluster. This decision allows storing data from infinite data streams without requiring unlimited storage space.
The algorithm introduces a function that changes the weight/relevance of each cluster in each iteration. Clusters that receive new data gain weight and the others lose. This function determines the relevance of a cluster in the current time window and, based on a tolerance value, DenStream determines whether the cluster will be removed from the model. This makes room for new clusters to be created while maintaining the shape and accuracy of the model.
Because of the adaptability of the model and the ability to deal with outliers, the quality of DenStream clustering is usually high.
DenStream is a clustering algorithm that groups data points based on their density in the search space. As a result, it can able to identify arbitrarily shaped clusters.
DenStream is divided into two phases: the online phase and the offline phase. In addition, the algorithm provides three types of micro-clusters: potential core-micro-cluster, outlier micro-cluster and core micro-cluster.
The first step of the algorithm is to process an initial number of data points determined through the parameter \(n_{init}\), which are accumulated in a batch and clustered. After processing this initial batch of observations, DenStream starts the online phase using these clusters as a starting point.
In the online phase, data points are processed one by one, as they form a data stream. When a new data point arrives, at first, DenStream checks if it belongs to one of the potential core-micro-clusters. These represent the core behaviors of the data in the online phase. In case the new data point is not within the boundaries to be assigned to an existing potential core-micro-cluster, the algorithm tries to assign it to the closest outlier micro-cluster.
Outlier micro-clusters are clusters with more sporadic data points, which can either evolve into a potential core-micro-cluster or be discarded according to the strategy of removing clusters with low relevance, i.e., that do not receive new data points in a given time interval. Finally, if the data point is not close to any cluster, the algorithm creates an outlier micro-cluster for that data point.
The offline phase occurs on user demand. In this step, DenStream uses a variation of the DBScan clustering algorithm that connects potential core-micro-clusters that are nearby to generate a core micro-cluster. Actually, the core micro-cluster is a collection of non-redundant potential core-micro-clusters, and this collection is supposed to cover the entire area that the data points would be in if it were possible to register all of them in data streaming scenarios.
Material and methods
The main objective of this work is to investigate the possibility of using the stream clustering algorithm DenStream to detect attacks on packets collected in IoT network traffic. The vast majority of studies focused on attack detection are based on batch learning algorithms, such as Random Forest (Resende & Drummond, 2018) and Support Vector Machine (Mohammadi, 2021). These algorithms approach learning as a static process. They first accumulate a large volume of observations, then analyze them and induce a learning model. Updating these models tend to be costly, because they involve repeating the aforementioned process (Ramírez-Gallego et al. 2017).
To analyze computer network traffic, more dynamic solutions are required. Since the network behavior changes over time, the algorithms involved must be able to learn incrementally, as observations are collected. Additionally, streams are potentially infinite and storing all these data for long periods is difficult. Stream mining algorithms meet these requirements better, as they can learn incrementally and do not require observations to be stored to be revisited during analyses.
The use of supervised learning in attack detection models is something to note. Supervised algorithms require labeled data points for training, i.e., in the case of attack detection, it is necessary to provide the algorithm with examples of normal and malicious behavior. Given the great diversity of attacks and the volume of data points that we can have when analyzing network traffic, preparing sets of properly labeled data for these applications is very challenging. A possible alternative is the use of clustering algorithms, which fall into the category of unsupervised learning. In this case, the algorithm tries to create groups by gathering data points that have a higher degree of similarity between them, as is the case of the aforementioned DenStream.
It is important to note that clustering algorithms only organize data points into clusters, and do not assign labels or classifications to them. Therefore, it is necessary to create additional mechanisms to be able to identify which clusters correspond to normal or malicious observations. In this work, we look for indicators in the behavior of the online-generated micro-clusters that show detectable variations when attacks occur. We will mostly analyze one indicator: the distance between the center of different types of micro-clusters produced by DenStream.
Figure 1 illustrates the step-by-step of this experiment, the details of which will be presented in the following sections. The whole experiment will be centered on the analysis of packets collected from network traffic.
Hence, in the process proposed in Figure 1, each data point represents a traffic packet. These packets are separated according to the device they were transmitted from/to and the protocol that is positioned just above IP in the protocol stack: ICMP, TCP or UDP. The rationale behind this separation is to organize the data points before they are presented to the clustering algorithm.
If all packets collected in a network are presented indiscriminately to the clustering algorithm, it will tend to create an excessive amount of clusters to represent the multiple devices and protocols. This makes it difficult to identify clusters representing normal and malicious behaviors. By separating the packets according to the device and protocol beforehand, we can run different instances of the clustering algorithm for each of these subgroups. Therefore, we allow the clustering performed for each subgroup to focus only on behaviors and events that are more specific to each device and protocol.
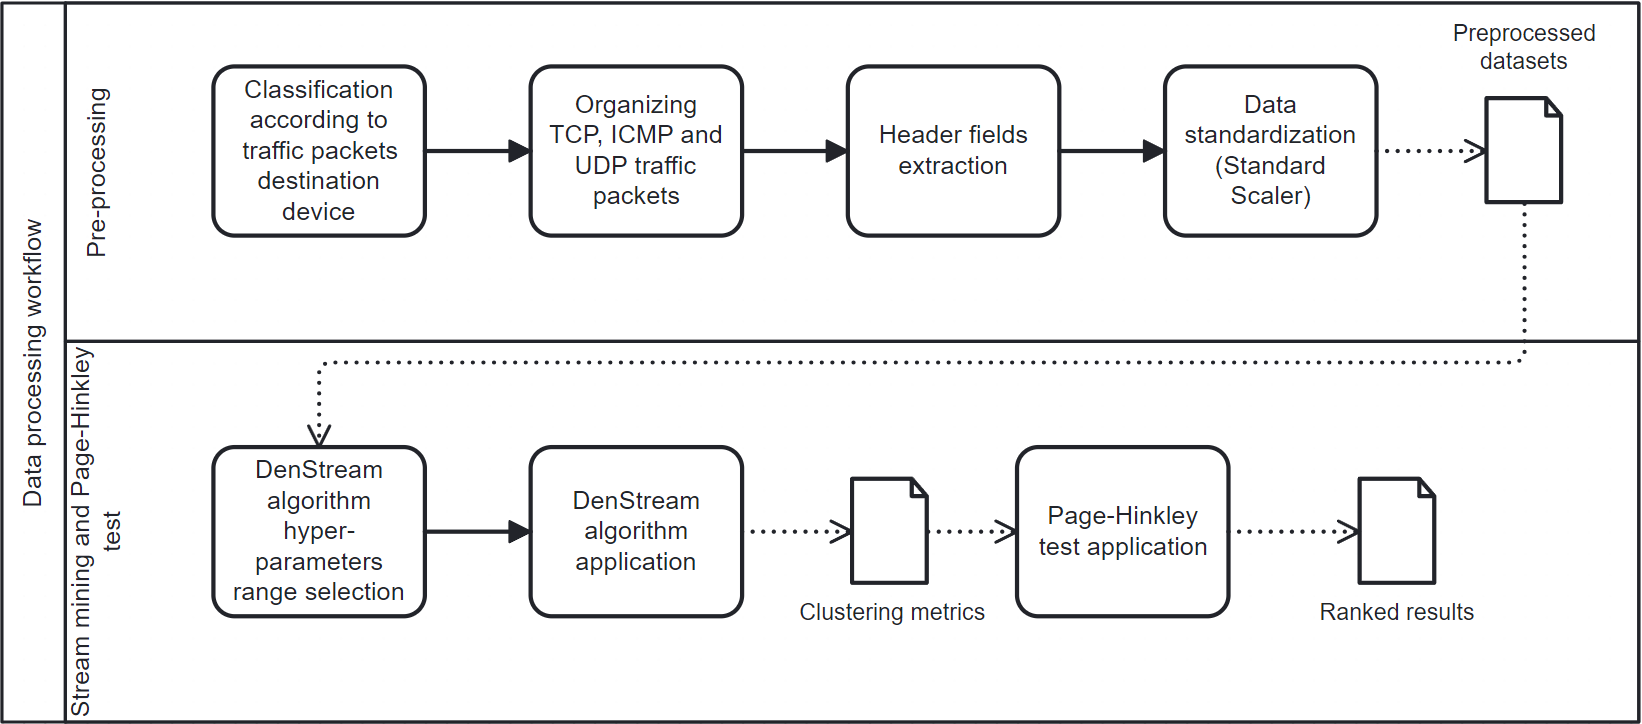
Preprocessing
The first step of preprocessing is to prepare the data streams that will be clustered by DenStream instances. We consider a scenario in which network traffic would be collected by a device or software at the point of interconnection of the local network with the Internet. These traffic packets are then classified according to the local network device that they have as their destination. The packets related to each device are further organized into three different groups: one for TCP packets, another for UDP packets and a third for ICMP packets. With the packets separated by device and protocol, we extract the header fields that can best signal the occurrence of different attacks, according to Nakagawa et al., (2021) and Anthi et al., 2019.
The selected fields are presented in Table 1. The frame_len field, being a field present in any packet, and the ip_flags, ip_flags_df, ip_flags_mf, ip_frag_offset and ip_ttl fields, being part of the IP header, are selected to compose all data points, regardless of whether the packet is UDP, TCP, or ICMP. The fields tcp_dstport, tcp_flags_syn, tcp_flags_ack, and tcp_flags_push are selected to compose the data points that represent TCP packets, while the field udp_dstport is selected for the data points that represent UDP packets. For ICMP packets, the icmp_code field is selected. At the end of this step, we have the dataset to be analyzed, which consists of three data flows (TCP, UDP and ICMP) for each network device.
| Attribute | Description |
|---|---|
| frame_len | Packet length |
| ip_flags | Packet fragmentation control flags |
| ip_flags_df | Flag Don’t Fragment which tells the intermediary not to fragment the packets |
| ip_flags_mf | Flag More Fragments which indicates if the fragment is the last in the composition |
| ip_frag_offset | Indicates where in the original package the fragment should be inserted |
| ip_ttl | Packet’s Time to Live |
| tcp_dstport | TCP destination port |
| tcp_flags_syn | Three-way handshake synchronization flag |
| tcp_flags_ack | Three-way handshake acknowlegment flag |
| tcp_flags_push | Flag indicating whether the packet should be buffered before being delivered to the application |
| udp_dstport | UDP destination port |
| icmp_code | ICMP packet type |
After preparing the data stream for the experiment, we conducted the data standardization. The dataset features are in quite different orders of magnitude. The frame_len field, for example, carries values greater than 1000, while the fields representing flags carry binary values. This may end up influencing the calculation of the distance between data points and, consequently, the way they are clustered. To standardize the data, we will use the Standard Scaler method, which transforms them to have a mean equal to zero and variance equal to 1. The implementation of the method employed in this work is provided by the River library (River, 2022).
Finally, with the data stream ready, we can move on to the step of choosing which ranges of values will be tested for the DenStream hyperparameters. In Table 2, a description of each hyperparameter function is presented. Changes in these hyperparameters cause major changes in the way the algorithm groups the incoming data stream.
Depending on the hyperparameter values, we have clusters of different sizes and shapes, which also influences the creation of new clusters and the merging of existing clusters. In addition, the hyperparameters also determine when older or less weighted clusters should be removed. All these points influence the metric we want to observe: distances between clusters. Therefore, it is important to choose broad value ranges that allow us to explore the potential of DenStream for the data we are analyzing. On the other hand, excessively wide value ranges tend to make it difficult to run the experiments, as we have a combinatorial explosion when considering all scenarios for all hyperparameters. As a starting point to determine the range of hyperparameter values, we used the values selected by Scaranti et al., (2022) and then expanded them to create our ranges of values, which are presented in Table 3.
| Hyperparameter | Description |
|---|---|
| \(\lambda\) - Decaying factor | Limits the influence of historic data, |
| higher \(\lambda\) values mean lower influence of | |
| historic data on the clustering process | |
| \(\beta\) - Outlier tolerance factor | Determines the boundary of outlier micro-clusters |
| in relation to core micro-clusters, | |
| \(\beta\) must assume \((0,1]\) | |
| \(\mu\) - Core weight threshold | Determines the boundary of outlier |
| micro-clusters in relation to core micro-clusters, | |
| \(\beta * \mu > 1\) | |
| \(\varepsilon\) - Maximum radius of a micro-cluster | Determines the maximum radius |
| of the micro-cluster neighborhood | |
| InitN - \(n_{\text{samples\_init}}\) | Number of iterations used to determine |
| the kickoff for the online phase | |
| \(v\) - Stream speed | Stream speed or the amount of data per time unit, |
| each package represents one data point |
| Hyperparameter | Value Range |
|---|---|
| \(\lambda\) - Decaying factor | [0.01, 0.05, 0.10, 0.25, 0.50, 0.75, 1.00] |
| \(\beta\) - Outlier tolerance factor | [0.01, 0.1, 0.2, 0.3, 0.4, 0.5, 1.00] |
| \(\mu\) - Core weight threshold | [10,100,1000,1500, 2000] |
| \(\epsilon\) - Maximum radius of a micro-cluster | [0.02, 0.05, 0.10, 0.25, 0.5, 0.75, 1.00, 5.00] |
| \(InitN\) - n_samples_init | (1000) |
| \(v\) - Stream speed | [1] |
Stream mining
With the data prepared, and the value ranges for the hyperparameters selected, the experiment moves to its main point: execution of instances of the DenStream algorithm so that it can be analyzed how the clusters behave during the occurrence of attacks.
To study how the distance between clusters can be related to the occurrence of attacks, two metrics based on the Euclidean distance were developed. For both metrics, we first need to build a matrix that computes the Euclidean distance between existing micro-clusters in a given iteration. More precisely, the clusters are analyzed pair-wise, and for each pair the Euclidean distance between the centers of these clusters is calculated. Suppose there are \(n\) clusters in a given iteration. A matrix \(D\) with dimensions \(n \times n\) will then be formed. Each position \(i,j\) of the matrix will store the Euclidean distance between the centers of clusters \(i\) and \(j\). From this matrix, we will extract two metrics: the average distance and the maximum distance. Considering these two metrics and the different types of micro-clusters, the following series were evaluated:
Maximum distance between potential core-micro-clusters: this series contains the largest Euclidean distance between the centers of the potential core-micro-clusters generated for each iteration.
Average distance between potential core-micro-clusters: this series contains the average Euclidean distance between the centers of the potential core-micro-clusters generated for each iteration.
Maximum distance between outlier micro-clusters: this series contains the largest Euclidean distance between the centers of the outlier micro-clusters generated for each iteration.
Average distance between micro-cluster outliers: this series contains the average Euclidean distance between the centers of the outlier micro-cluster generated for each iteration.
Maximum distance considering potential and outlier micro-clusters: this series contains the largest Euclidean distance between the centers of both micro-cluster types generated for each iteration.
Average distance considering potential and outlier micro-clusters: this series contains the average Euclidean distance between the centers of both micro-cluster types generated for each iteration.
We computed and stored these series for each combination of DenStream hyperparameter values.
Page-Hinkley test
Proposed by Alan Page and Lawrence Hinkley in 1954 (Page, 1954), the Page-Hinkley test is a statistical technique widely used in sequential analysis to detect sudden and unexpected changes in monitored data over time. In other words, the Page-Hinkley test can be used to detect anomalies in time series. It’s based on the concept of “cumulative sum”, which is a way of tracking the behavior of data over time and calculating the sum of deviations or differences between observed and expected values. The technique is particularly useful in situations where one wants to quickly detect any significant changes in the data under analysis.
The practical application of the Page-Hinkley test involves calculating the cumulative sum of the deviations between the observed data and the expected values. This sum is compared with a predefined threshold, and when this threshold is exceeded, a change is detected and considered statistically significant. The result is an alert indicating a change in values in the series.
In the context of this study, we employ the Page-Hinkley test to automatically detect changes in the series formed by the metrics under analysis, aiming to assess whether they serve as indicators of attacks. The idea is to compare the changes detected by the Page Hinkley test with the points where attacks were observed. Scenarios in which most of the detected changes align with attacks suggest that the metrics have the potential to be attack indicators. To objectively analyze these scenarios, we collect the number of true and false Page Hinkley alerts in each case as well as their delay to signal attacks. Subsequently, we select scenarios with the most promising results for further analysis.
Table 4 presents the hyperparameter values used in the Page Hinkley test. The DenStream implementation employed in this work is provided by the River library (River, 2023), which uses Python programming language. Experiments were performed in a computer with an Intel Core i5-8600k processor and 16 GB of RAM DDR4 2400MHz.
| Parameter name | Description | Values |
|---|---|---|
| min_instances | The minimum number of instances before start detecting change | [1000] |
| delta | Controls sensibility threshold for the test | [0.005] |
| threshold | The change detection threshold (lambda) | [20, 50, 100, 150, 200] |
| alpha | The forgetting factor, used to weight the observed value and the mean | [0.9999] |
In our study, the test was applied to all the series containing the metrics derived from Euclidean distances between the centers of the micro-clusters. Over them, we run the Page-Hinkley test with different values of threshold. For each threshold, we compute the following metrics:
Total of alerts: represents the number of times the Page-Hinkley test indicated a change in the series.
Total of true positives: the amount of times an alert happened at a time an attack was active.
Total of false positives: the amount of times an alert happened at a time when there was no active attack.
Delay: delay between the start of an attack and the alert generated by Page-Hinkley.
Datasets
To perform the experiments, the dataset made publicly available by Anthi et al., 2019 was used. To generate this dataset, the researchers created a controlled environment with home IoT devices connected to the Internet. Different attacks were executed against these IoT devices, and the packets of this network traffic were collected throughout the experiment. The researchers then made available a dataset that contained the TCP/IP protocol header fields for each of the collected packets, except the IP addresses, which were omitted. All packets are labeled according to the attack performed at that time and the source or destination device of the packet.
The devices used to create the dataset are listed in Table 5. The following attacks were performed against these devices:
Man in the middle: attack where the attacker positions themselves between the transmitter and the receiver and eavesdrops on sensitive information. One way to create an attack like this would be for the attacker to take advantage of some weakness of the various and heterogeneous IoT devices in a home and through it gain access to monitor the rest of the data stream of the internal network, potentially capturing private and/or sensitive information.
Denial of Service (DoS): an attack where a device is forced to be unable to perform a service. This type of attack saturates a device with so many requests that it denies new legitimate requests due to its inability to respond to them.
Scanning: in this attack, the attacker scans the network to gather information about the potential target. Using this technique, the attacker can check which devices and services are being used by the observed network and potentially exploit a vulnerability of the active applications.
| IoT device | Protocols |
|---|---|
| TP-Link NC200 (cam) | WiFi |
| Hive Hub | Ethernet & ZigBee |
| Lifx Smart Lamp | WiFi & ZigBee |
| Samsung Smart Things Hub | Ethernet & BLE |
| TP-Link SmartPlug | WiFi |
To carry out the experiment, we processed this dataset so that we had the packets separated according to device and protocol (TCP, UDP, or ICMP), and only the fields of interest for our experiment were extracted.
Table 6 shows the details of each of the scenarios we set up in the experiment, considering the different devices and protocols. The “Size” column indicates the total number of packets for the respective device and protocol. All packets of each scenario are ordered by their timestamp to form a series, and the columns “Start” and “End” of the table show in which position of the series the attacks start and end.
| Device | Protocol | Size | Attack type | Start | End |
|---|---|---|---|---|---|
| TPLink Cam | TCP | 22376 | Scanning | 9611 | 18141 |
| DoS | 18142 | 22322 | |||
| MITM | 22323 | 22375 | |||
| UDP | 7626 | Scanning | 6161 | 6470 | |
| DoS | 6471 | 7552 | |||
| MITM | 7553 | 7625 | |||
| Hive | TCP | 47905 | Scanning | 13128 | 33777 |
| DoS | 33778 | 47298 | |||
| MITM | 47299 | 47905 | |||
| ICMP | 2710 | DoS | 2363 | 2559 | |
| MITM | 2559 | 2710 | |||
| LifX | TCP | 12513 | DoS | 2883 | 12338 |
| MITM | 12339 | 12513 | |||
| ICMP | 13127 | MITM | 12857 | 13127 | |
| Smart Things | TCP | 42180 | Scanning | 14618 | 33567 |
| DoS | 33568 | 41519 | |||
| MITM | 41520 | 42180 | |||
| TpLink Plug | TCP | 14142 | DoS | 13909 | 14142 |
| UDP | 10898 | DoS | 1863 | 2465 | |
| iot-toolkit | 2466 | 10898 |
Results
To present the results obtained with the experiment’s execution, we first show the combinations of DenStream hyperparameter values that yielded the best results for each scenario.
Next, we analyze in more detail the scenarios with the best results to check how the series derived from the Euclidean distances between micro-clusters behaved when attacks took place.
Analysis of values for DenStream hyperparameters
With all scenarios in hand, the first analysis verified if the hyperparameter values that yielded the best results were similar; this could indicate if it would be possible to find hyperparameter values that could be used for different devices and protocols in a network. To do so, we ranked the hyperparameter value combinations in each scenario according to the number of false positives, number of true positives, and delay on true positive detection. We then selected the three best hyperparameter value combinations for each device and protocol pair.
All the best combinations found were related to series consisting of the maximum distance between potential core-microclusters.
Table [tab:rankedResults] shows that the DenStream hyperparameter values tend to be similar within each scenario, but no values stand out when all the scenarios are considered together. This suggests that the optimal DenStream hyperparameter values for each device and protocol are different, and it is important to pay close attention to the hyperparameter values that are being selected in the DenStream clustering phase.
Another result to note was that, except for TP-Link Plug UDP scenario, for the top three ranked results on each scenario, the parameter that fluctuated was \(\epsilon\). This is the hyperparameter that defines the maximum radius of the micro-cluster neighborhood, and as the results suggest, varying its value up to a certain point did not affect the clustering behavior for these series.
Analysis of series behavior
Considering only the series produced for the best hyperparameter value combinations, the Page-Hinkley test detected the start of the malicious traffic for all the devices, and the delay values were relatively low. The lowest delay value was 17 iterations, each iteration being a single packet, found for the Hive ICMP scenario, whereas the highest one was 282 iterations, found for the Hive TCP scenario. This suggests that the maximum Euclidean distance between potential core-micro-clusters could be used to detect the start of attacks on these devices.
Figures 2 and 3 illustrate these situations. The red vertical line indicates the iteration at which malicious packets were introduced and the blue markers indicate the iteration where the Page-Hinkley test detected a change in the series.
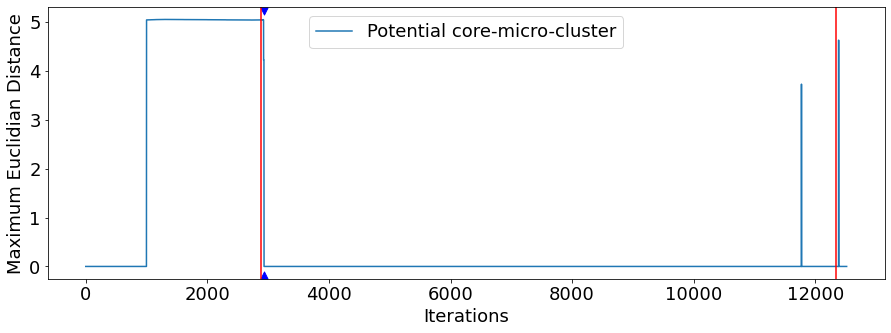
Figure 2 shows the scenario for the Lifx device and TCP protocol, where a denial of service attack was initiated at iteration 2883 and lasted until iteration 12338, being immediately succeeded by a man-in-the-middle attack that extended until the scenario was over. In the graph, it is noted that, during the period before the first attack, the observed series remained stable. When the first attack begins, the series shows a sudden and strong drop, which is detected by the Page Hinkley test. The transition between different attacks is not signaled by the series.
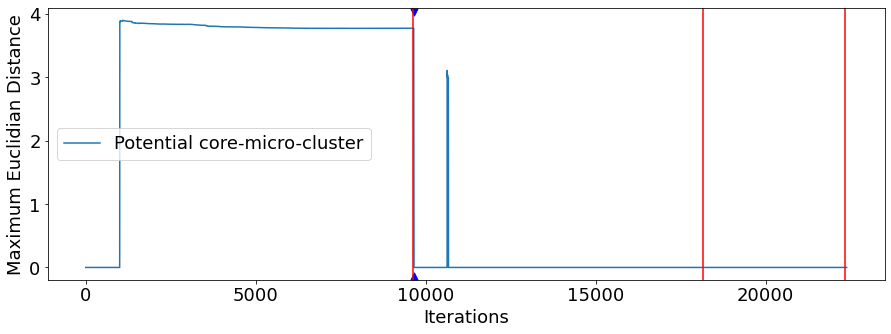
Figure 3 shows the scenario for the TP-Link Cam device and TCP protocol, where a scanning attack was initiated at iteration 9611 and lasted until iteration 18141, being immediately succeeded by a denial of service attack that extended until iteration 22322, and immediately succeeded by a man-in-the-middle attack that lasted until the scenario was closed. In the graph, it is noted that, during the period before the first attack, the observed series remained stable. Similar to the previous example, the series shows a drop when the first attack starts, which is quickly detected by the Page Hinkley test.
To further illustrate the results, Figure 4 and Figure 5 shows results with UDP and ICMP protocols.
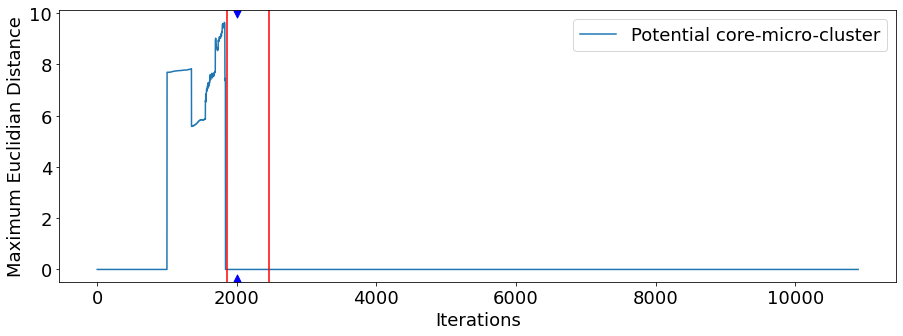
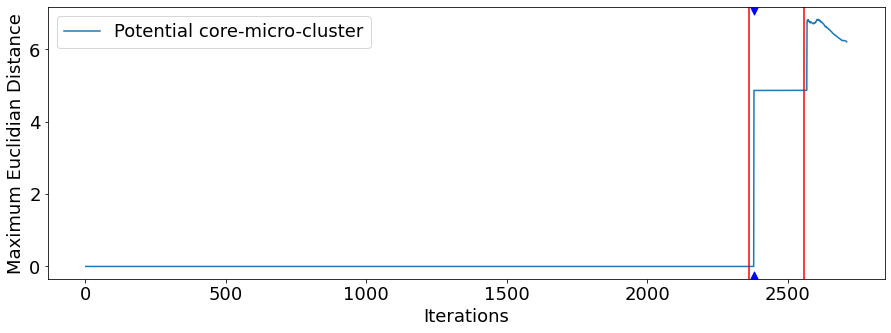
Figure 4 shows the scenario for the TP-Link Plug device and UDP protocol, where a denial of service attack was initiated at iteration 1863 and lasted until iteration 2465, being immediately succeeded by an IoT-toolkit attack that lasted until the scenario was closed at iteration 10898. In the graph, we observe that in this scenario, before the introduction of the first attack, the series values fluctuated more than in other cases, but Page-Hinkley test was still able to produce an alert with a delay of 139 iterations. Additionally, the series clearly demonstrates a change in its behavior when the attack begins, meaning that the maximum distance between the potential core-micro-clusters served as a reliable indicator of the attack occurrence.
Figure 5 shows the scenario for the Hive device and ICMP protocol, where a denial of service attack was initiated at iteration 2363 and lasted until iteration 2559, being immediately succeeded by a man-in-the-middle attack that lasted until the scenario was closed at iteration 2710. The observed series remains stable until the first attack was initiated, then the series remains flat, and a new peak occurred immediately after the second attack is introduced. Therefore, in this scenario, the series shows a change for a transition between two different attacks, which did not happen in the other analyzed scenarios. However, the Page-Hinkley test was not able to produce an alert for this change in the series. This might be attributed to the parameter values that are not sensitive enough to detect changes of that magnitude. The observed shift in the series, indicative of a change in attack type, is not as pronounced as those typically observed during the transition from normal to attack traffic.
Conclusions
In this work, we investigate the possibility of using the DenStream clustering algorithm to detect attacks on IoT network traffic. The central idea was to analyze whether monitoring metrics related to the distance between clusters formed by DenStream could offer indicators of the occurrence of attacks. The process of applying DenStream for traffic analysis started with data preparation. Packets collected from network traffic were separated by device and protocol (TCP, UDP, or ICMP). Fields from the headers of the protocols of interest (IP, TCP, UDP, and ICMP) were then selected to compose the data points that were analyzed by the algorithm.
During the application of DenStream, metrics related to the distance between potential core-micro-clusters and outlier micro-clusters in the search space were collected at each iteration. By applying the Page-Hinkley test to automatically detect changes in the measured distances, we found that for all the devices the behavior of the maximum distances between potential core-micro-clusters signaled the occurrence of attacks. Therefore, monitoring these distances can be the core of a technique to detect attacks on these devices.
The selection of hyperparameter values for DenStream is a critical aspect that deserves careful consideration. The experiments showed that each combination of the device and protocol required a different set of hyperparameter values to yield the best results. This poses a significant challenge when it comes to deploying this algorithm in practical scenarios since tuning hyperparameters for every single device would be an impractical task for end users. Therefore, additional techniques must be developed to automate the process of hyperparameter tuning.
In future work, some propositions could be made. First, testing the performance of this implementation with different datasets could prove valuable for further validation of the proposed method. Secondly, work with other ways of producing the observations that will be analyzed by DenStream. In addition to performing packet-by-packet analysis, the option of analyzing IP flows could also be tested. Third, validate the performance of this implementation in bigger scenarios with more devices.
Author contributions
G.K. Tazima participated in Conceptualization, Data Curation, Formal Analysis, Investigation, Methodology, Programs, Validation, Writing – preparation of the original draft, Visualization. B.B. Zarpelão participated in Conceptualization, Funding Acquisition, Methodology, Project Management, Resources, Supervision, Validation, Writing – revision and editing.
Conflicts of interest
The authors declare no conflict of interest.
Acknowledgments
The authors wish to thank Fundação Araucária de Apoio ao Desenvolvimento Científico e Tecnológico do Estado do Paraná, Brazil, for the financial support (Chamada Pública 09/2021 - Pesquisa Básica e Aplicada
References
Aggarwal, C. C., Philip, S. Y., Han, J., & Wang, J. (2003). A Framework for Clustering Evolving Data Streams. In Association for Computing Machinery, VLDB 03 Proceedings [Conference]. 29th International Conference on Very Large Data Bases. https://doi.org/10.5555/1315451.1315460
Anthi, E., Williams, L., Słowińska, M., Theodorakopoulos, G., & Burnap, P. (2019). A supervised intrusion detection system for smart home IoT devices. IEEE Internet of Things Journal, 6(5), 9042–9053.
Cao, F., Ester, M., Qian, W., & Zhou, A. (2006). Density-Based Clustering over an Evolving Data Stream with Noise. In Society for Industrial and Applied Mathematics, Proceedings of the 2006 SIAM International Conference on Data Mining [Conference]. SIAM International Conference on Data Mining, Philadelphia. https://doi.org/10.1137/1.9781611972764.29
Chow, R. (2017). The Last Mile for IoT Privacy. IEEE Security & Privacy, 15(6), 73–76. https://doi.org/10.1109/MSP.2017.4251118
Gama, J. (2010). Knowledge discovery from data streams. CRC Press. 12
Gama, J., & Rodrigues, P. P. (2007). Data Stream Processing. In J. Gama & M. M. Gaber (Eds.), Learning from Data Streams: Processing Techniques in Sensor Networks (pp. 25–39). Springer Berlin Heidelberg. https://doi.org/10.1007/3-540-73679-4_3
Lohiya, R., & Thakkar, A. (2020). A Review on Machine Learning and Deep Learning Perspectives of IDS for IoT: Recent Updates, Security Issues, and Challenges. Archives of Computational Methods in Engineering, 28, 3211–3243. https://doi.org/10.1007/s11831-020-09496-0
Mohammadi, M., Rashid, T. A., Karim, S. H., Aldalwie, A. H. M., Tho, Q. T., Bidaki, M., Rahmani, A. M., & Hosseinzadeh, M. (2021). A comprehensive survey and taxonomy of the SVM-based intrusion detection systems. Journal of Network and Computer Applications, 178, 102983. https://doi.org/https://doi.org/10.1016/j.jnca.2021.102983
Moustafa, N., Turnbull, B., & Choo, K.-K. R. (2019). An ensemble intrusion detection technique based on proposed statistical flow features for protecting network traffic of internet of things. IEEE Internet of Things Journal, 6(3), 4815–4830. https://doi.org/10.1109/JIOT.2018.2871719
Muthukrishnan, S. (2005). Data streams: Algorithms and applications. Now Publishers Inc.
Nakagawa, F. H. Y., Barbon, S. J., & Zarpelão, B. B. (2021). Attack Detection in Smart Home IoT Networks using CluStream and Page-Hinkley Test. In Institute of Electrical and Electronics Engineers, 2021 IEEE Latin-American Conference on Communications (LATINCOM) [Conference]. Latin-American Conference on Communications (LATINCOM), Santo Domingo, Dominican Republic. https://doi.org/10.1109/LATINCOM53176.2021.9647769
Page, E. S. (1954). Continuous Inspection Schemes. Biometrika, 41(1/2), 100–115. https://doi.org/10.1093/biomet/41.1-2.100
Pishva, D. (2017). Internet of things: Security and privacy issues and possible solution. In Institute of Electrical and Electronics Engineers, International Conference on Advanced Communication Technology (ICACT) [Conference]. 19th International Conference on Advanced Communication Technology (ICACT), PyeongChang, Korea, 797–808. https://doi.org/10.23919/ICACT.2017.7890229
Ramírez-Gallego, S., Krawczyk, B., García, S., Woźniak, M., & Herrera, F. (2017). A survey on data preprocessing for data stream mining: Current status and future directions. Neurocomputing, 239, 39–57. https://doi.org/https://doi.org/10.1016/j.neucom.2017.01.078
Resende, P. A. A., & Drummond, A. C. (2018). A Survey of Random Forest Based Methods for Intrusion Detection Systems. 51(3). https://doi.org/10.1145/3178582
River. (2022). Standardscaler. https://riverml.xyz/0.15.0/api/preprocessing/StandardScaler/
River. (2023). Pagehinkley. https://riverml.xyz/0.18.0/api/drift/PageHinkley/
Scaranti, G. F., Carvalho, L. F., Barbon, S., Lloret, J., & Proença, M. L. (2022). Unsupervised online anomaly detection in Software Defined Network environments. Expert Systems with Applications, 191, 116225. https://doi.org/https://doi.org/10.1016/j.eswa.2021.116225
Yang, K., Ren, J., Zhu, Y., & Zhang, W. (2018). Active Learning for Wireless IoT Intrusion Detection. IEEE Wireless Communications, 25(6), 19–25. https://doi.org/10.1109/MWC.2017.1800079
Yin, C., Xia, L., Zhang, S., Sun, R., & Wang, J. (2018). Improved clustering algorithm based on high-speed network data stream. Soft computing (Berlin, Germany), 22(13), 4185–4195.
Zarpelão, B. B., Miani, R. S., Kawakani, C. T., & de Alvarenga, S. C. (2017). A survey of intrusion detection in Internet of Things. Journal of Network and Computer Applications, 84, 25–37. https://doi.org/https://doi.org/10.1016/j.jnca.2017.02.009
Zheng, S., Apthorpe, N., Chetty, M., & Feamster, N. (2018). User Perceptions of Smart Home IoT Privacy. Proc. ACM Hum.-Comput. Interact., 2(CSCW). https://doi.org/10.1145/3274469