
Pigment Identification and Depth Profile in Pictorial Artworks by Non-Invasive Hybrid XRD-XRF Portable System
Mendoza-Cuevas, A.; Fernández-de-Cossio, J.; Ali, N.; Atwa., D. M.
DOI 10.5433/1679-0375.2023.v44.48506
Citation Semin., Ciênc. Exatas Tecnol. 2023, v. 44: e48506
Abstract:
A non-invasive XRD-XRF portable system for Archaeometry based on Angle and Energy Dispersive XRD (Hybrid XRD) plus XRF has been previously proposed by the authors. It gathers an attractive compromise between analytical performance and measurement time, as well as a higher energy penetration with respect to conventional Angle Dispersive XRD (ADXRD). Penetration to inside layers, usually perceived as an inconvenient for non-invasive portable XRF or XRD analyzer, can instead be informative for the proposed hybrid XRD-XRF system to perform depth profiling analysis. This hybrid configuration harness from the redundancy of the data, in the sense that a single XRF or XRD specimen, taken at the same sample point, appears in multiple spectrograms to account for data counting statistics. On this work, the performance of the system on standard reference material, as well as the identification of pigments in the surface layer of paintings is evaluated. Specific Hybrid data processing was conceived to examine the layer structure of the painting, by distinguishing signal patterns of the exposed and the under layers. The system is ventured for the first time to the study of pictorial artworks on coffin and cartonnage samples from ancient Egyptian sarcophagi. Prussian blue pigment in a modeled painting is also discussed.
Keywords: portable XRD-XRF, painting, non-invasive, EDXRD, archaeometry space-0.1cm
Introduction
Paintings are challenging for analytical techniques because they are made of complex mixtures of materials of inorganic and organic composition with crystalline or amorphous structures distributed in layers. Non-invasive analysis of paintings by portable X-ray diffraction (XRD) apparatus has been scarcely approached, in particular when X-ray fluorescence (XRF) alone cannot provide sufficient information.
Different spectroscopic techniques were applied in the last decades for the non-invasive study of valuable paintings by portable systems (Brunetti et al., 2016) to support restoration and conservation treatments, and to answer historical questions concerning attribution or provenance. Besides these efforts, it is often imperative to assess the pigment’s layers sequence to identify specific execution techniques, in a non-invasive way.
A preliminary laboratory test on a wide set of pigments made possible the distinction of a variety of inorganic pigments by Raman spectroscopy (Brunetti et al., 2016; Colomban, 2012). Although considerable information is obtained in moderate accumulation times by this technique, the power of laser radiation should be controlled for the safety of paintings. On the other hand, XRD complemented with chemical analysis by XRF and vibrational spectroscopy (FTIR and Raman), is currently the most reliable technic for the identification of minerals or synthetic crystalline materials, supported by extensive powder diffraction databases.
Particle Induced X-ray emission and Backscattering Spectrometry were used at the Accélérateur Grand Louvre pour l’ Analysie Elémentaire (AGLAE) to study cross-section samples from Renaissance Paint layers giving access to the proportion of pigments and binder (de Viguerie et al., 2009). Chemical composition and thickness have been determined by a non-invasive Portable XRF (PXRF) system, based on X-ray absorption through different layers in a favorable case, to determine how Leonardo da Vinci made the sfumato (de Viguerie et al., 2010). However, except only for the most external layer, combined PXRF and visible reflectance analysis were required to determine on drawings the sequence of two layers of different colors, because pigments with the same elemental composition but a different chemical formula can’t be distinguished with XRF alone (Bonizzoni et al., 2008). Non-invasive XRD, can in principle overcome this problem.
The basic principle behind X-ray diffraction is the solution of Bragg’s equation, given by
\[ 2d\sin{\theta}=n\lambda,\]
that relates integer n multiples of the X-ray wavelength \(\lambda\) and the lattice plane distance d between atomic sheets in a simple crystal, to the angles \(\theta\) at which a reflected X-ray produce constructive interference with the incident beam.
The lattice does not diffract at most angles (other than Bragg’s angles) because X-rays deflected are out of phase, cancelling each other. In the conventional XRD, Angle Dispersive XRD (ADXRD), a monochromatic, collimated X-ray beam strikes a crystalline sample. This system scans over a range of diffraction angles, yielding diffraction peaks that can be correlated to distinct families of atomic planes in crystalline specimens in accordance with Bragg’s Law. In Energy Dispersive XRD (EDXRD), the angle can be kept constant during measurements, so, a goniometer for the exact measurement of different diffraction angles is not necessary. The lattice plane distance in Bragg’s equation is determined experimentally by the wavelength of the diffracted beams of the polychromatic radiation, binned in an energy-sensitive point detector, where energy \(E\) is related to \(\lambda\) by \[ E=hc/\lambda,\]
where, \(h\) is the Planck constant and \(c\) is speed of light in vacuum. Both, ADXRD and EDXRD, are well stablished techniques, and more detail can be found elsewhere (Kämpfe et al., 2005).
An issue of portable ADXRD is the time required to sweep the whole angle range stepped at a minuscule distance. The introduction of X-ray optics reduces the measurement time but at a considerably greater cost. In contrast, EDXRD, can attain a significant reduction of time with a compact low-cost setup, while larger d range can be accessed, by exciting with a polychromatic beam, at fixed angles (Mendoza-Cuevas & Perez Gravie, 2011; Uda et al., 2005).
The first setup used a tube with a Copper anode, the standard anode in ADXRD (Uda et al., 2005). This system was used in the pigment analysis in the tomb of Amenhotep III (Egypt 1364 B.C. or earlier), for supporting the suggestion that Egyptian artists at that time used to complete everything in one color before moving on to the next. In the Uda setup, XRF mode was measured at one angle, and XRD mode at another angle. The XRD signals were very poor, and the Cu peak of the anode intrudes into the middle of the energy range. Further, XRD signals above the anode peak (\(\approx\) 8.04 keV) are strongly suppressed. For example, orpiment was identified by S and As in the XRF mode, complemented by a single distinctive XRD line, interfering as a tiny left shoulder of the Cu-k\(\alpha\) peak (Uda et al., 2005). This interference could be avoided in principle by selecting another measurement angle, but the suitable angle cannot be anticipated in general without prior knowledge of pigment composition. The issue becomes more difficult when there are multiple XRD lines.
XRD signals of a single spectrogram measured at a fixed angle can be significantly enhanced by increasing the effective energy range with an anode tube of Palladium (Mendoza-Cuevas & Perez Gravie, 2011) and Silver (Mendoza-Cuevas et al., 2015), expanding also the XRD detectable range up to \(\approx\) 21 keV (more than 2.5 the range in the first Uda setup). Both XRF and XRD signals are acquired simultaneously from the same sample point.
Further, Mendoza-Cuevas et al., 2015 developed a multi-angle acquisition in the portable hybrid XRD-XRF system, implementing a combined angle-energy dispersive XRD (AEDXRD) capability, where a few energy dispersive spectra are measured, covering a wide angular range with a large step size. A probabilistic data processing was also developed (Mendoza-Cuevas & Fernández-de-Cossio, 2016a), combining the spectra to form a single XRD spectrum covering an extended d range (Hybrid XRD), with simultaneous XRF analysis, attaining a better compromise between analytical performance (\(d\)-spacing accuracy, resolution, signal sensitivity), and acquisition time (Mendoza-Cuevas & Fernández-de-Cossio, 2016b), as well as a higher energy penetration with respect to ADXRD.
Here, we present a non-invasive identification of pigments and layers in pictorial artworks with the portable hybrid XRD-XRF. The samples studied are unique: they dated from Ancient Egypt, which prompted us the use of non-destructive analysis, with respect to the sample (in this case sample should be returned and glued to the artwork, especially for the valuable Egyptian blue) or the use of non-invasive analysis (without extracting sample) when an appropriate instrument is available. The hybrid methods are evaluated with ancient pictorial artworks in Egyptian sarcophagus coffins and cartonnage samples, as well as the identification of Prussian blue in the modeled painting.
Materials and methods
EDXRD-XRF measurements
The non-invasive measurements were performed in reflection mode of detection, using a low-power X-ray EDXRD-XRF-based instrument (Mendoza-Cuevas et al., 2015). The energy spanning from 0 to 26 keV is binned in 2048 channels, for a bin width of 12.6996 eV. EDXRD-XRF signals are collected in an energy range of 0 to 22 keV at 28 kV and 200 \(\mu\)A, using bremsstrahlung radiation coming from an Ag anode tube (10–50 kV, 200 \(\mu\)A, 400 \(\mu\)m anode spot). The hybrid system is geared for variable angle measurements.
The samples were measured at several angles, uniformly increasing in a logarithmic scale. Measurements of pigments were performed for 50 - 400 sec/angle at a maximum of 24 angles logarithmically distributed from 5\(^\circ\) to 25\(^\circ\). The 3D data is collected in triplets (intensity (\(I\)), angle (\(\theta\)), and energy (\(E\))) using a Si-drift detector (SDD) (136 eV FWHM at Mn k\(\alpha\)). The X-ray beams are directed to the surface of the pictorial layer for pigment identification and depth profile analysis. A sensitive laser supports the positioning procedure by accurately measuring the distance.
Spectra from the studied samples were initially acquired at 15° for optimum object positioning determined along depth scanning measurements, in a direction bisecting the angle formed by the beams (Z axis) (Mendoza-Cuevas & Fernández-de-Cossio, 2016a). The sample is translated with respect to the measurement head (X-ray tube and detector) along the Z axis to fine-tune the distance between the X-ray tube and the sample (\(\approx\) 5cm). Cross section of samples was studied by optical microscopy in order to evaluate the proposed depth profile method that can be used when non-invasive analysis of cultural heritage objects is carried out.
Conventional ADXRD measurements
Conventional diffractograms (ADXRD) were obtained using a Panalytical X’Pert Pro (3040/60) Multi-Purpose Diffractometer with Anode of Copper (Cu), Tube Current 30 [mA], Tube Tension 40 [kV], Step size [0.03\(^\circ\)], Time per Step [1.5 s], div slit is 0.5 degrees and sample length 10 mm. Signals from the Laboratory diffractometer and spectrometer were measured in the XRD laboratory of the Department of Laser Interaction with Matters, Laser Institute for Research and Applications.
Data processing
To build the XRF hybrid, XRF lines are detected from the raw ED-XRD-XRF, and the intensities are accumulated through the measured 3D data of multiple spectra, after background subtraction (Mendoza-Cuevas & Fernández-de-Cossio, 2016a). The XRF peaks are identified from candidate element in the individual spectrum and the intensity in the bin of the peak energy at each spectrum are summed along the angles, to obtain a hybrid XRF spectrum. The candidate elements are identified from the lines of the XRF hybrid.
To build the hybrid diffractogram, the counts of XRD peaks are accumulated along iso-d curves from the measured 3D data (after background subtraction). A peak is regarded as XRD when two other peaks at the same iso-d curve have S/N \(\geq\) 1.5, and are not recognized as XRF signal. More than three peaks are considered when S/N<1.5.
Once a peak is labeled as XRD, by the mentioned criterion, all the peaks detected at different angles, laying in the near of the iso-d curve contribute to the hybrid diffractogram. While XRF signals remain fixed in a channel energy disregarding the measuring angle, XRD signal move with the angle according to Bragg law. With multiple angle acquisition XRD and XRF signals overlapping at one angle can be resolved at another angle.
The hybrid construction was improved, by binning the iso-d curves in logarithmic scale and probabilistically pondering the peak contribution relative to signal/noise ratio and the intensity, enhancing the precision with respect to our previously reported construction (Mendoza-Cuevas & Fernández-de-Cossio, 2016a).
A “resolution hybrid” optimize the energy resolution and beam dimensions, while a “precision hybrid” optimizes the precision of the calculated d-spacing values, improved by counting statistics gathered from the redundancy of XRD and XRF lines, typically appearing in more than one angle.
The “precision hybrid” is more suitable for material identification, the scope of this article The relative intensities of XRD peaks obtained by EDXRD do not fairly correspond to those obtained by ADXRD. However, the hybrid diffractogram we obtained from standard reference materials, showed similar relative intensities with respect to ADXRD data obtained by laboratory and synchrotron XRD system (Mendoza-Cuevas, 2019; Mendoza-Cuevas & Fernández-de-Cossio, 2016b; Scardi et al., 2018).
The methodologies described are visualized with an in-house software we call ArtxArt, developed in the Archaeometry Lab (Mendoza-Cuevas, 2019). The methods used here were coded in preliminary scripts, mostly in Wolfram Mathematica (2021) and Visual C# (2000).
Built-in database
A database was constructed from ASCII files of mineral diffraction data, downloaded from the American Mineralogist Crystal Structure Database (Robert T. Downs & Michelle Hall-Wallace, 2003) and from the PDWIN database (Ivanov et al., 1995). The files are parsed by Art X Art software, and indexes are created for speeding the search of mineral names, composition, diffraction peaks, and other free text searches.
Diffractograms and XRF spectra were analyzed for pigment identification using Art X Art software, by interrogating the built-in database of minerals with the signals obtained from the spectra at different excitation source’s anodes. Identification of pigments is performed by ranking the candidates according to a score that reflects the quality of the matching of the more intense d-spacing, detected in the hybrid diffractogram, after filtering by the chemical elements detected by XRF spectra.
Density- and Ari- plots
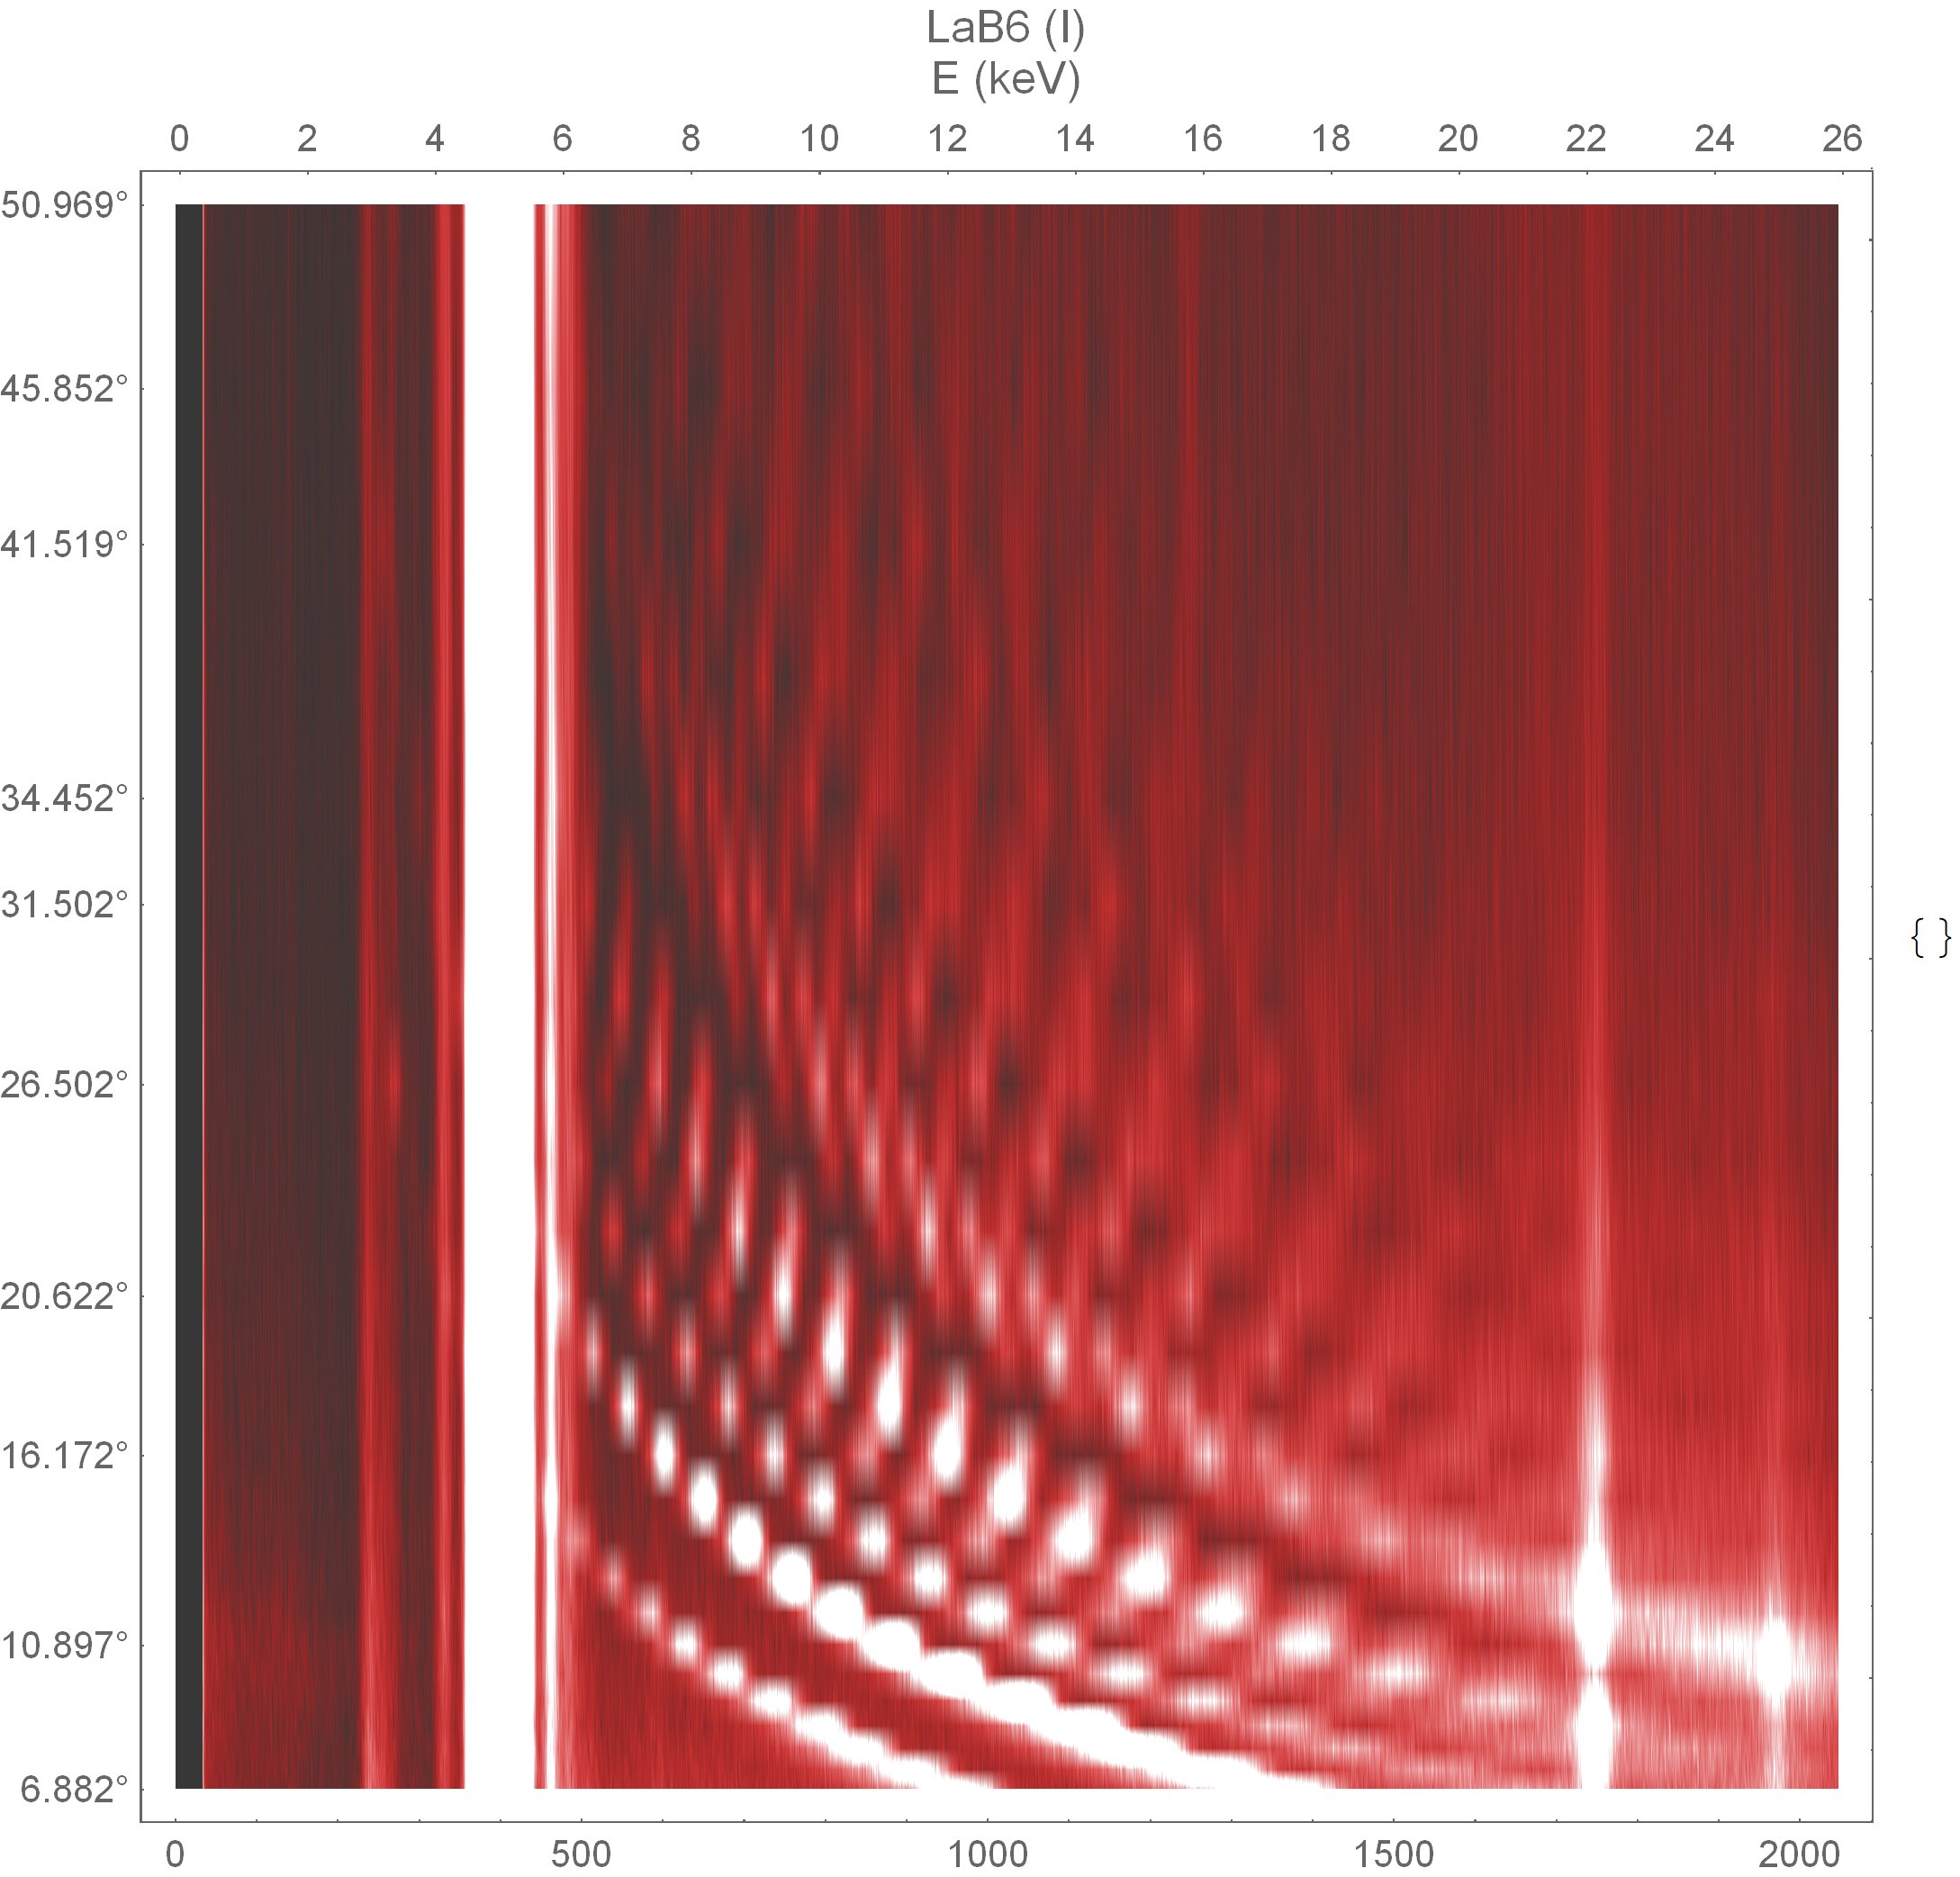
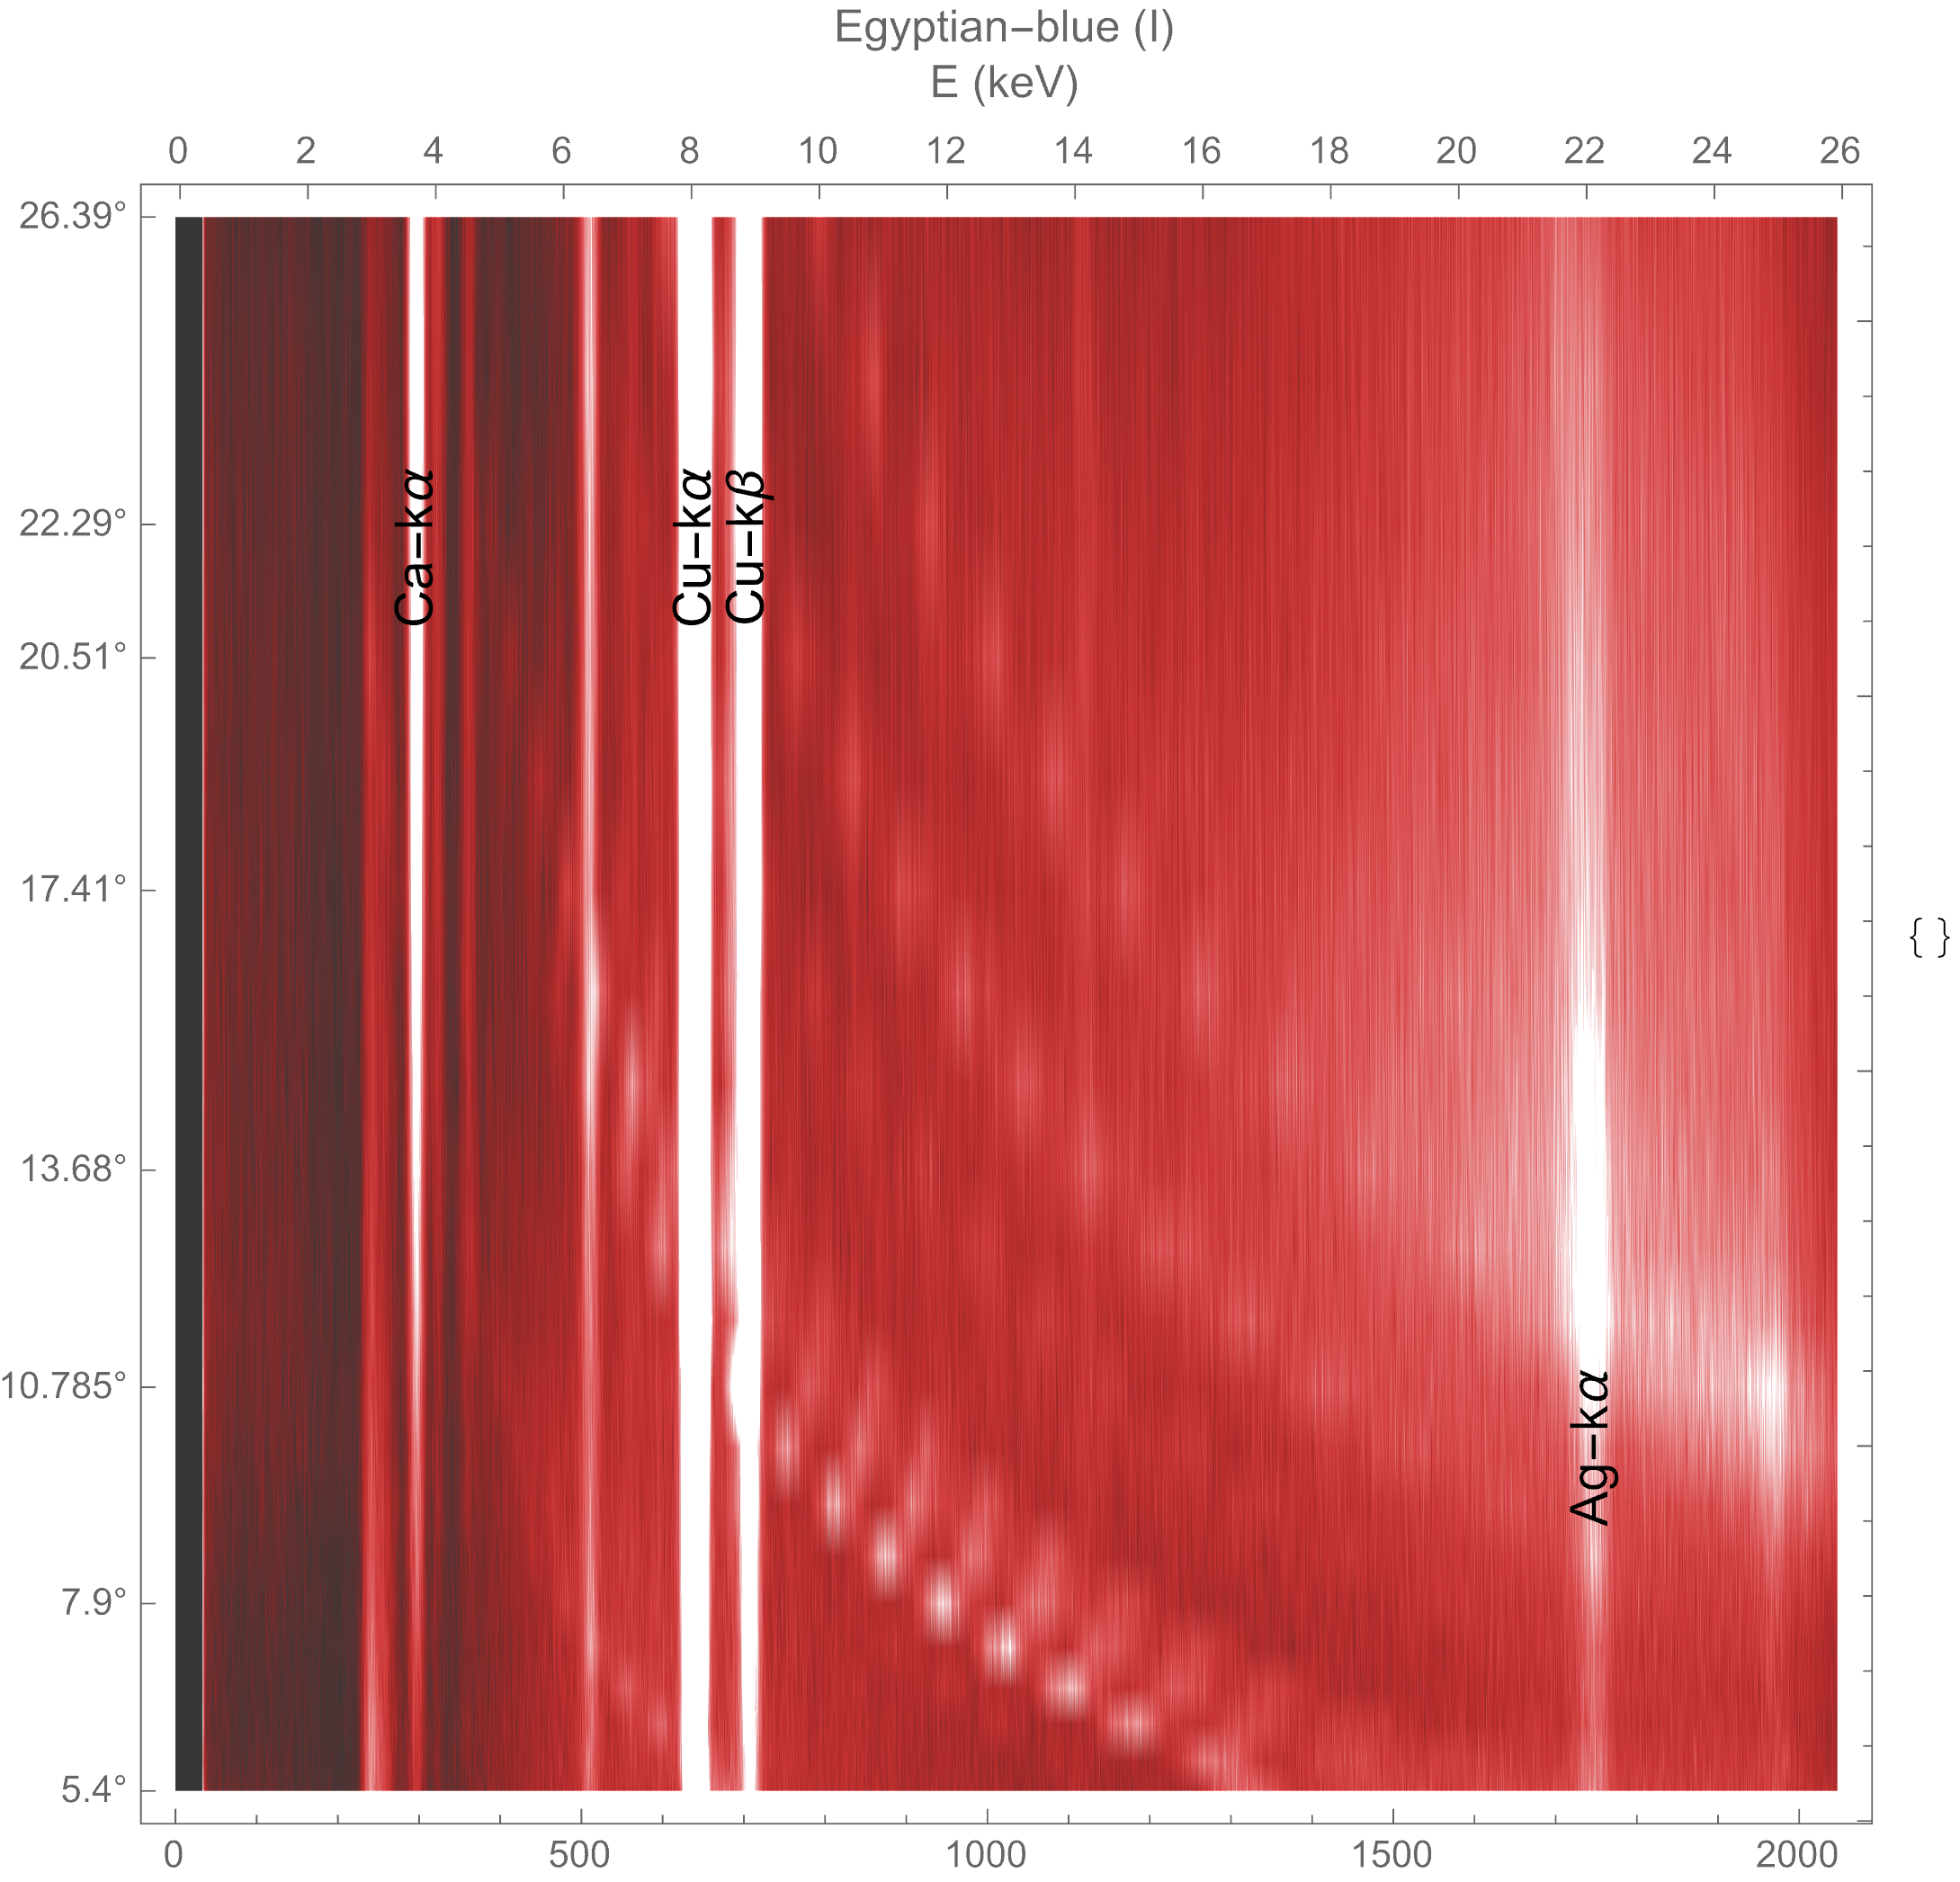
Density plots produce a colorized 2D maps of the intensity \(I\left(E,\theta\right)\), measured in the energy channel E at the diffraction angle \(\theta\). Larger intensities are shown whiter, while smaller are shown in dark red. Density plots are build-in standard plot in Wolfram Mathematica.
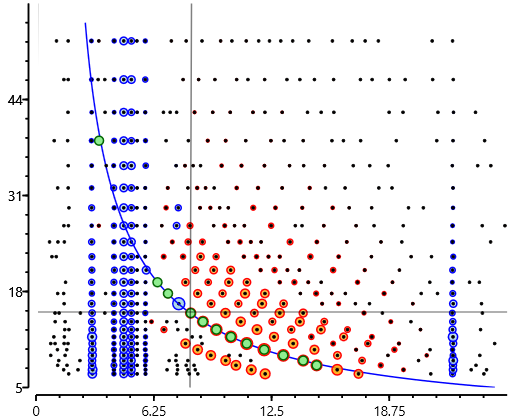
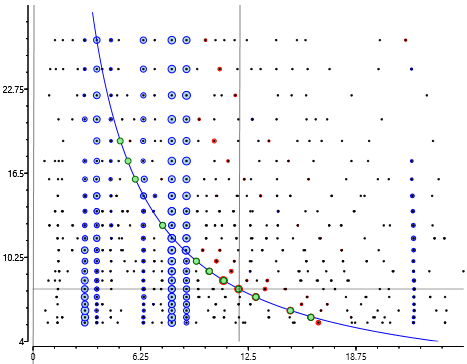
Ari plot is an in-house devised dotted plot, implemented in the Art X Art software. It is a “discrete” version of the Density plot, to enhance the iso-d curves over the background, by pondering the size of each peak relative to its signal/noise ratio and the intensity. In both plots, vertical XRF lines, and XRD lines (“moving” along iso-\(d\) curves), are simultaneously visualized. However, iso-d lines are not well contrasted in the density plot when the number of measuring angles is relatively small. AriPlot, was tailored for sharpen the signal to noise of the XRD lines, substantially emphasizing the iso-\(d\) curves, especially when data is measured in few angles.
Standard reference material
Lanthanum hexaboride (LaB\(_6\)) is used in XRD as standard reference for lines position and peaks shape (Kaiser & Watters, 2010), to calibrate instrumental broadening and location of diffraction peaks. Measurements of standard LaB\(_6\) were performed for 200 and 400 sec/angle at a maximum of 25 angles, distributed uniformly in the logarithmic scale from 5° to 50°, as previously described (Mendoza-Cuevas & Fernández-de-Cossio, 2016a). Six of these angles were also chosen to evaluate the deterioration of performance with a reduced number of angles.
Pictorial artworks and modeled painting
The study of Egyptian polychromic wooden objects is fundamental to understand the chemical nature of used colors, ancient makers techniques and highlight ancient Egyptian thoughts and their lifestyle. The coffin we investigated here was discovered by Dr. Zahi Hawass excavation mission in 2010, near to the Pyramid of Unas, at Saqqara excavation site. According to the archaeological data that was found at the discovered tomb as well as the object’s artistic features, it belongs to the late era (664 BC. To 331 BC.), it was found in a reused tomb belonging originally to the old kingdom (4200 years ago).
This wooden object is made in a unique artistic way of double coffins, one inside the other. The object is 203 cm length and 53 cm shoulder width and covered with colored drawings and colored face of deceased for only the inner coffin that found in a bad condition of preservation, Figure 1(a). The inscriptions on the coffin proved that the mummy inside the coffin belongs to a princess called Nefer was covered by full cartonnage parts as shown in Figure 1(b).
(a)

(b)

Cartonnage is a type of material that composes the Ancient Egyptian funerary masks. It was made of layers of linen covered with plaster. The full cartonnage, covered with decorated paintings, reflects the believes of the old Egyptians that paintings guarantee the continuity of life. In our case, the cartonnage is in good conditions of conservation, with just few deteriorated parts. Fully decorated pieces were found to cover the head, chest, stomach, and legs. The great value of this finding lies in the fact that we could almost collect the entire palette of pigments of the ancient Egypt from these coffins and cartonnage.
The most striking property of Egyptian pigments is that they are almost indestructible pigments: they resist concentrated acids, alkalis, and organic solvents (Pizzo et al., 2013). This extreme stability explains why many artworks have survived for centuries under the drastic conditions of the desert, and burial for long periods (Salvadó et al., 2005). Ancient Egyptian reached the perfect artistic techniques in the fourth dynasty (2575 BC-2465 BC), not only in the painting’s collor palettes but also for the manufacturing techniques, so the late era artists had the same style and used the same color palettes (Anderson et al., 2014).
Samples of the mentioned, coffin and cartonnages, see Figure 1, are fragments and traces of different colors, smaller than 2 mm length representative of the color palette used. Our non-invasive methodology could have been applied in-situ without requiring sample extraction. In the present study, the fragments were taken off the object already. Even so, we proceed with the non-invasive analysis of the samples forward, preserving them intact for later artwork restoration.
Prussian blue, thought to be the first purely synthetic pigment, is a representative modern pigment used since the early 18\(^{th}\) century that cannot be identified by XRF analysis alone. Model samples of oil painting on canvas prepared with zinc white and inert materials such as calcite and barite were analyzed. Its pictorials layers are composed of pure pigment Prussian blue (powder from Marmieri Co.).
Comparisons of hybrid portable XRD versus Laboratory XRD
Laboratory Diffractograms were analyzed for pigment identification, interrogating the built-in database, from the hybrid spectrum. Both the ADXRD and the EDXRD diffractogram are plotted in terms of the reciprocal distance \(q\) (1/Å), for better spacing of the peaks. To convert \(\theta\) to \(q\), we use the conventional formula, given by
\[ q=\frac{4\pi}{\lambda sin{\theta}},\]
where \(\theta\) is the diffraction angle, and \(\lambda\) is the X-ray wavelength.
Results and discussions
Evaluation of standard reference material
Interplane distance \(d\), obtained by the portable Hybrid XRD-XRF system for the standard LaB\(_6\), is compared with the respective values reported in the Certification of Standard Reference Material 660b (LaB\(_6\)) to evaluate the accuracy.
XRD signals and the iso-\(d\) curves are pretty apparent in the density plot, Figure 2(a), and emphasized in the Ariplot, Figure 2(b). XRF signals are represented by blue dots, XRD signals are represented by orange dots. Iso-\(d\) curve crossing the cursor position is highlighted in green.
| (a) |
 |
| (b) |
 |
| (c) |
 |
| (d) |
 |
| (e) |
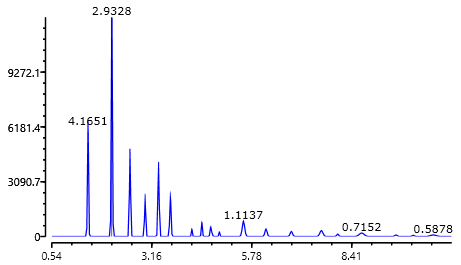 |
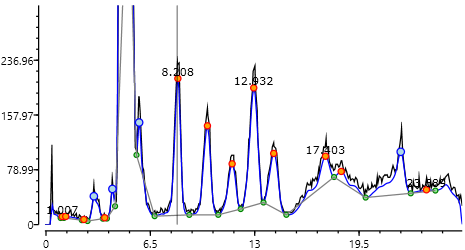
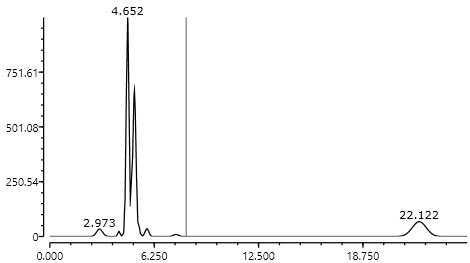
A single raw ED XRD-XRF spectrum and a hybrid XRD/XRF spectra were obtained from raw data processing, Figure 2(c)-(e). The accuracy of the hybrid construction can be judged by the intensity ratios and \(d\)-spacing obtained in the analysis of LaB\(_6\), in comparison to the reported for this reference standard, see Table 1.
| hkl | \(d\)-theo | \(d\)-obs (centroid) | error (25 angles) | error (6 angles) | Standard deviation | peak max |
|---|---|---|---|---|---|---|
| 001 | 4.15692 | 4.15704 | -0.00013 | 0.00748 | 0.074624 | 446.865 |
| 011 | 2.93938 | 2.93798 | 0.001399 | 0.001952 | 0.023719 | 1290.61 |
| 111 | 2.4 | 2.40133 | -0.00133 | -0.00077 | 0.014569 | 639.864 |
| 002 | 2.07846 | 2.07826 | 0.000202 | 3.8E-05 | 0.012303 | 319.465 |
| 012 | 1.85903 | 1.86073 | -0.0017 | -0.00129 | 0.007994 | 684.621 |
| 112 | 1.69705 | 1.69884 | -0.00178 | -0.00284 | 0.007492 | 301.858 |
| 22 | 1.46969 | 1.4719 | -0.0022 | -0.00318 | 0.00934 | 88.9519 |
| 122 | 1.38564 | 1.38613 | -0.00049 | -0.00188 | 0.005714 | 305.527 |
| 013 | 1.31453 | 1.31558 | -0.00105 | -0.00178 | 0.006689 | 191.804 |
| 113 | 1.25336 | 1.25575 | -0.00239 | -0.00371 | 0.006853 | 89.6139 |
| 222 | 1.2 | - | - | - | - | - |
| 023 | 1.15292 | 1.15354 | -0.00062 | - | 0.007829 | 41.8537 |
| 123 | 1.11098 | 1.11569 | -0.00471 | -0.00603 | 0.005083 | 91.6252 |
| 004 | 1.03923 | 1.04021 | -0.00098 | -0.0048 | 0.007534 | 16.6536 |
| 223 | 1.0082 | 0.999488 | 0.008713 | 0.008353 | 0.004449 | 46.7537 |
| 114 | 0.979795 | - | - | - | - | - |
| 133 | 0.953662 | - | - | - | - | - |
| 024 | 0.929515 | - | - | - | - | - |
| 124 | 0.907113 | 0.908868 | -0.00175 | -0.00239 | 0.005438 | 31.886 |
| 233 | 0.886258 | - | - | 0.016673 | 0.00427 | 6.53558 |
| 224 | 0.848527 | 0.848083 | 0.000444 | - | 0.006009 | 9.1882 |
| 034 | 0.831383 | - | - | - | - | - |
| 134 | 0.815238 | 0.815997 | -0.00076 | -0.00275 | 0.004366 | 25.0314 |
| 333 | 0.799999 | - | - | - | - | - |
| 234 | 0.77192 | 0.770857 | 0.001063 | -0.00195 | 0.004506 | 14.5845 |
| 225 | 0.723626 | - | - | -0.00437 | 0.002861 | 4.71978 |
| 334 | 0.712905 | 0.712234 | 0.000671 | -0.00141 | 0.00597 | 10.033 |
| 244 | 0.692819 | 0.690958 | 0.001861 | - | 0.003128 | 8.23955 |
| 344 | 0.649201 | 0.648725 | 0.000476 | - | 0.004401 | 7.4773 |
| 245 | 0.619676 | 0.620634 | -0.00096 | - | 0.003732 | 4.74836 |
| 136 | 0.612904 | 0.608308 | 0.004596 | 0.004719 | 0.002623 | 5.17991 |
| 345 | 0.587877 | 0.588965 | -0.00109 | - | 0.004166 | 3.96167 |
| 046 | 0.576461 | 0.57638 | 8.07E-05 | - | 0.002716 | 3.91953 |
| 246 | 0.555491 | 0.557654 | -0.00216 | - | 0.002175 | 4.02469 |
| 037 | 0.54583 | 0.547862 | -0.00203 | - | 0.00334 | 3.13054 |
Note that in Table 1, the errors of estimated \(d\)-spacing do not exceed one standard deviation from the theoretical, with the only exceptions of one line (hkl 233), from a total of 38 detected, but it does not exceed two standard deviations. The errors with the 25 angles dataset vary in the order of thousandths Å, and are smaller in most of the cases when compared with the six angles dataset. The maximum error is 0.001589 in the former and 0.002062 in the later. This is consistent with the \(\sqrt N\) rule of thumb improvements in accuracy, considering that resolution, intensity and quality of d-spacing peaks vary with angle. The six angles hybrid shows no appreciable deterioration of XRD signals when compared with the 25 angles hybrid. Accuracy of \(d\)-spacing values could be improved with a different selection of six angles if relevant prior expectation of the sample components is available.
Pigment identification in the Egyptian sarcophagus
The pigment analysis from XRF and XRD signals interpretation of all samples examined are summarized in Table 2.
| Sample description | Major element | XRF minor or trace element | XRF-XRD Pigments identification |
Dark blue cartonnage | Ca, Cu | Ti, Fe, Zn, Sr | Gyptian blue (calcium copper silicate cuprorivaite, CaCuSi\(_4\)O\(_{10}\)) |
Black coffin | Ca, Fe | P, Cl, Ti, Zn, Sr | Probably carbon (C) based black. Ca (calcite) and Fe (earth) from preparation layer |
Blue-green / cartonnage | Ca, Fe, Cu*, As* | P, Cl, Ti, Zn, Sr, Pb | Ca and Fe from preparation layer, calcium copper silicate cuprorivaite and wollastonite in pictorial layer |
Green-blue cartonnage | Ca, Fe, Cu* | P, Cl, Ti, Zn, Sr | Cu for green color, calcium copper silicate cuprorivaite and more wollastonite that blue-green cartonnage |
Red (face) coffin | Ca, Fe* | P, Cl, S, Ti, Sr | Fe for red (red earth) |
Black cartonnage | - | - | Organic and amorphous pigment (probably carbon black by exclusion) |
Green coffin | Ca, Fe, Zn, Cu* | P, Cl, Ti, Sr | Cu for green color. Calcium copper silicate Cuprorivaite |
Yellow coffin | Ca, Fe*, Cu | P, Cl, Ti, Zn, As, Pb, Sr | Yellow ochre |
Yellow- red/ cartonnage | Ca, Fe*, Cu, Pb* | P, Cl, Ti, Zn | Pb for red color and Fe for yellow. Minium (red) and yellow ochre. confirmed by XRD. Calcite as preparation layer |
Red-blue (chest) coffin | Ca, Fe*, Pb*, Cu* | Ti, Cu, Zn | Higher concentration of Pb in the red region – minium |
Golden cartonnage | Au* | Zn, Fe, Ni | Gold |
*Main element for color
Dark blue of the cartonnage
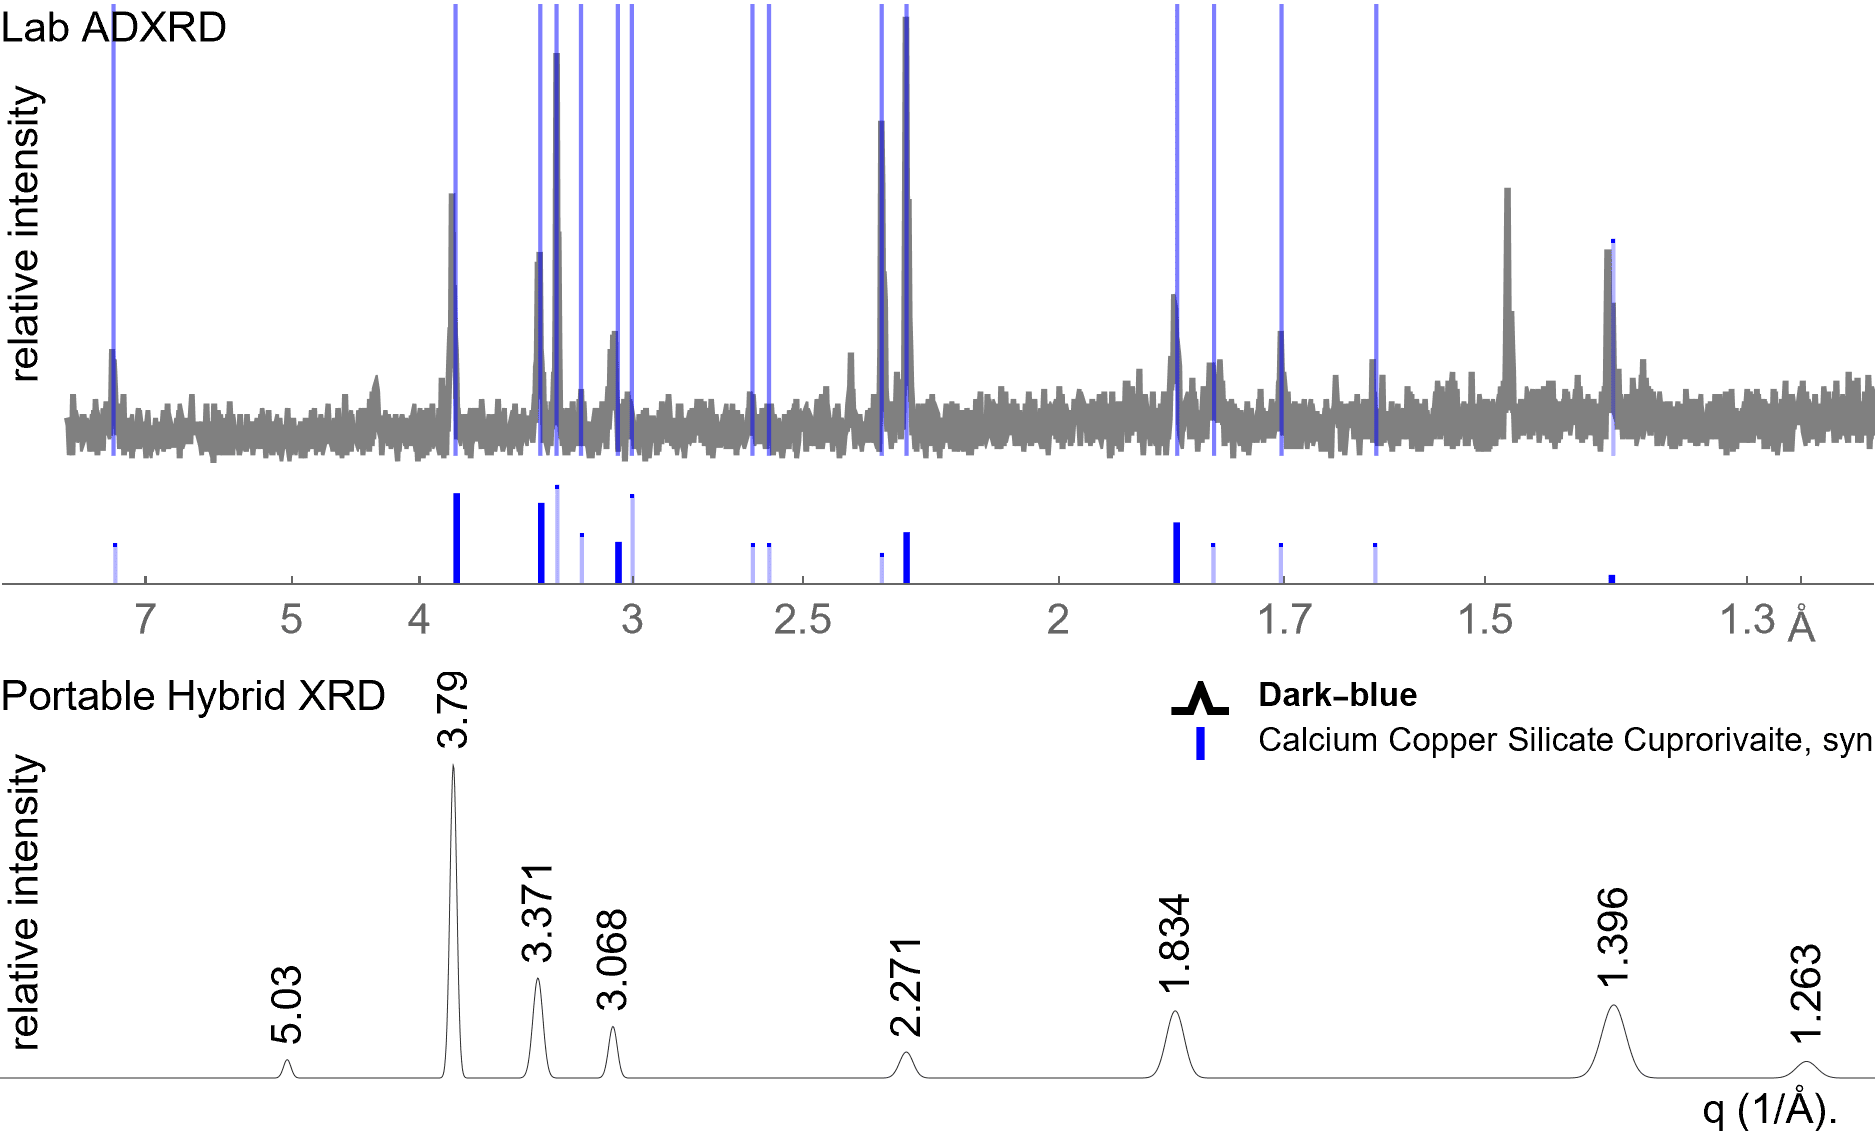
Figure 3(a) shows spectral signals evidencing the presence of dark blue pigments in the Egyptian cartonnage samples. The iso-\(d\) curves emphasized in the Ariplot, enable the distinction of low-intense \(d\)-spacing signals within the prominent one Figure 3(b). The hybrid spectra are confronted with diffraction lines and chemical composition reported in the mineral databases. Dark blue showed high consistency with Egyptian blue and was identified with a maximum score by the automatic mineral identification subroutine of Art X Art software.
| (a) |
 |
| (b) |
 |
The six more intense peaks of the hybrid diffractogram matched with XRD lines of cuprorivaite (calcium copper silicate (CaCuSi\(_4\)O\(_{10}\) or CaOCuO(SiO\(_2\))\(_4\)) at entry PDF850858 in the PDFWIN database, see Figure 4.
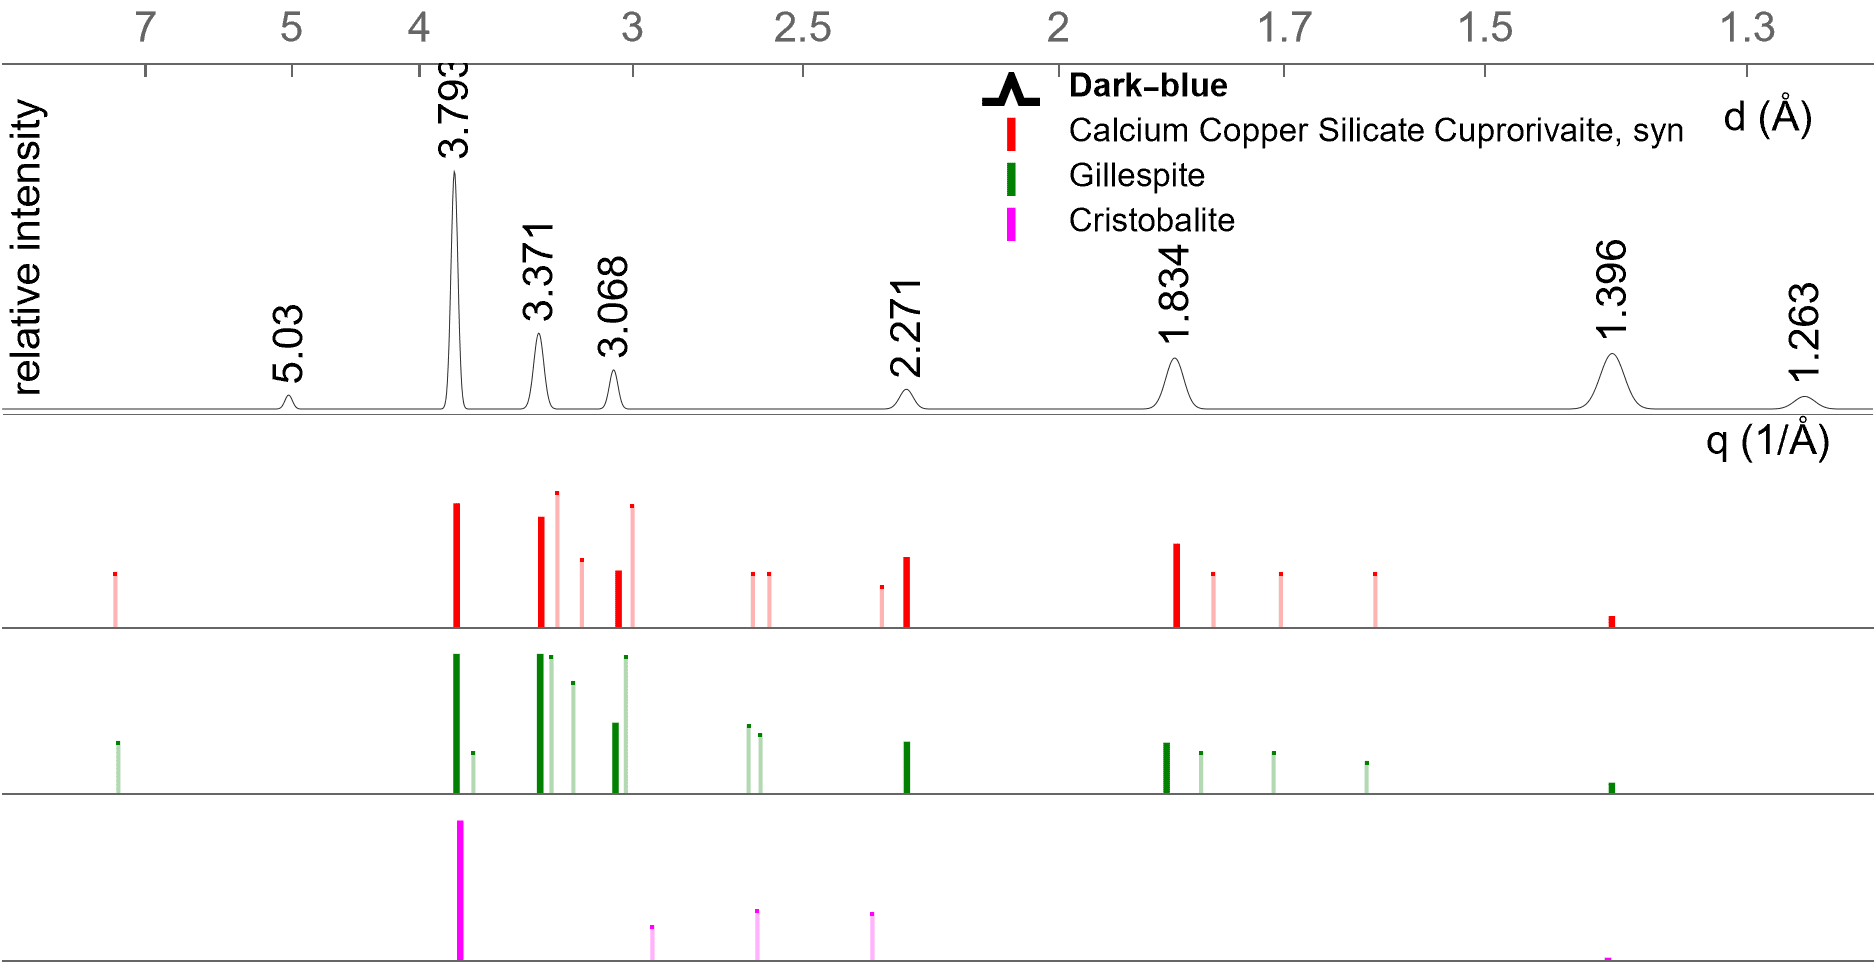
Database search were filtered by chemical composition matching the major elements detected by XRF, Cu and Ca. This XRF filter, enabled the Art X Art software, to exclude gillespite (BaFeSi\(_4\)O\(_{10}\) or BaFe+2Si\(_4\)O\(_{10}\)) that have similar XRD but differing by the presence of Ba XRF lines in the former, increasing the specificity of simultaneous Hybrid XRD plus XRF analysis for mineral and pigment identification. The line 2.783 Å could be explained by silica addition, however, the detection of Si by XRF is generally more difficult (particularly for low content) if the detector is not close enough to the sample. We can overcome this issue by inserting Helium flux in the path from sample to detector. A presence of cristobalite (polymorphs of silica) is also suggested in Figure 4.
Some intensity ratios of hybrid XRD peaks of the dark blue hybrid diffractogram are not in agreement with the expected JCPDS values measured by ADXRD instruments. Alteration of intensities ratios are usually attributed to a preferential orientation of grains (texture) and have been also reported in the non-invasive analysis of paintings by ADXRD portable XRD system (Gianoncelli et al., 2008).
Additional XRF measurements were performed at a closer distance to a sample than previously described in EDXRD-XRF measurements. The spectra for most of samples indicated the presence of P, Cl and Ti or Ba. The content of P may indicate that the alkali source used was actually in plant ash and not Natron (sodium carbonate hydrate, syn), which was demonstrated previously by the analysis of various samples of Egyptian blue (Jaksch et al., 1983).
On the other hand, Natron (PDF0800) main d lines at 3.04 Å, 3.02 Å, and 2.89 Å, overlap with the lines 3.057 Å and 2.783 Å of dark blue identified as Egyptian blue, and cannot be well distinguished by XRD uniquely.
The observation of dark blue under optical microscopy revealed coarse grain of blue crystals, in correspondence with the thick form of large clusters of crystals that produced the dark blue color appearance of coarse Egyptian blue, reported in the literature (Jaksch et al., 1983).
The findings of our XRD/XRF analysis are consistent with the historical production technology of this pigment.
The Egyptian blue, also known as calcium copper silicate (CaCuSi\(_4\)O\(_{10}\) or CaOCuO(SiO\(_2\))\(_4\)) or cuprorivaite, is a synthetic blue pigment made up of a mixture of silica, lime, copper, and alkali (Lambert, 1984). Its color is due to a calcium-copper tetrasilicate CaOCuO(SiO\(_2\))\(_4\) of exactly the same composition as the naturally occurring mineral cuprorivaite. It is considered the first synthetic pigment, produced during the third millennium BC and continued in use until the end of the Greco-Roman period (332 BC–395 AD). It is made by heating to around 850-950 °C a mixture of a calcium compound (typically calcium carbonate), a copper-containing compound (malachite or filings from copper ingots, bronze scrap, and other alloys), silica sand (desert sand) containing quartz and soda or potash (plant ash, potash, or the desert salt ’natron’) as a flux (Jaksch et al., 1983).
If certain conditions were not met, the Egyptian blue would have not been satisfactorily produced. For example, if the temperatures were above 1050 °C, it would have become an unstable (Jaksch et al., 1983).
If too much lime was added, wollastonite (CaSiO\(_3\)) forms can appear, giving the pigment a green color. Ancient Egypt blue tones, from rich dark blue used as an alternative for lapis lazuli, to a pale almost turquoise blue, could be created by either varying the proportion of alkali to copper in the mixture or by varying the degree to which the pigment was crushed (coarse ground – dark blue; fine ground – pale blue) (Rehren, 2008).
The crystalline phases identified in the dark blue sample with the hybrid system, in Figure 5(a), support that conditions achieved during heating were precise, confirming the experience of ancient Egyptians in the domain of chemical technologies during the period of the studied pieces.
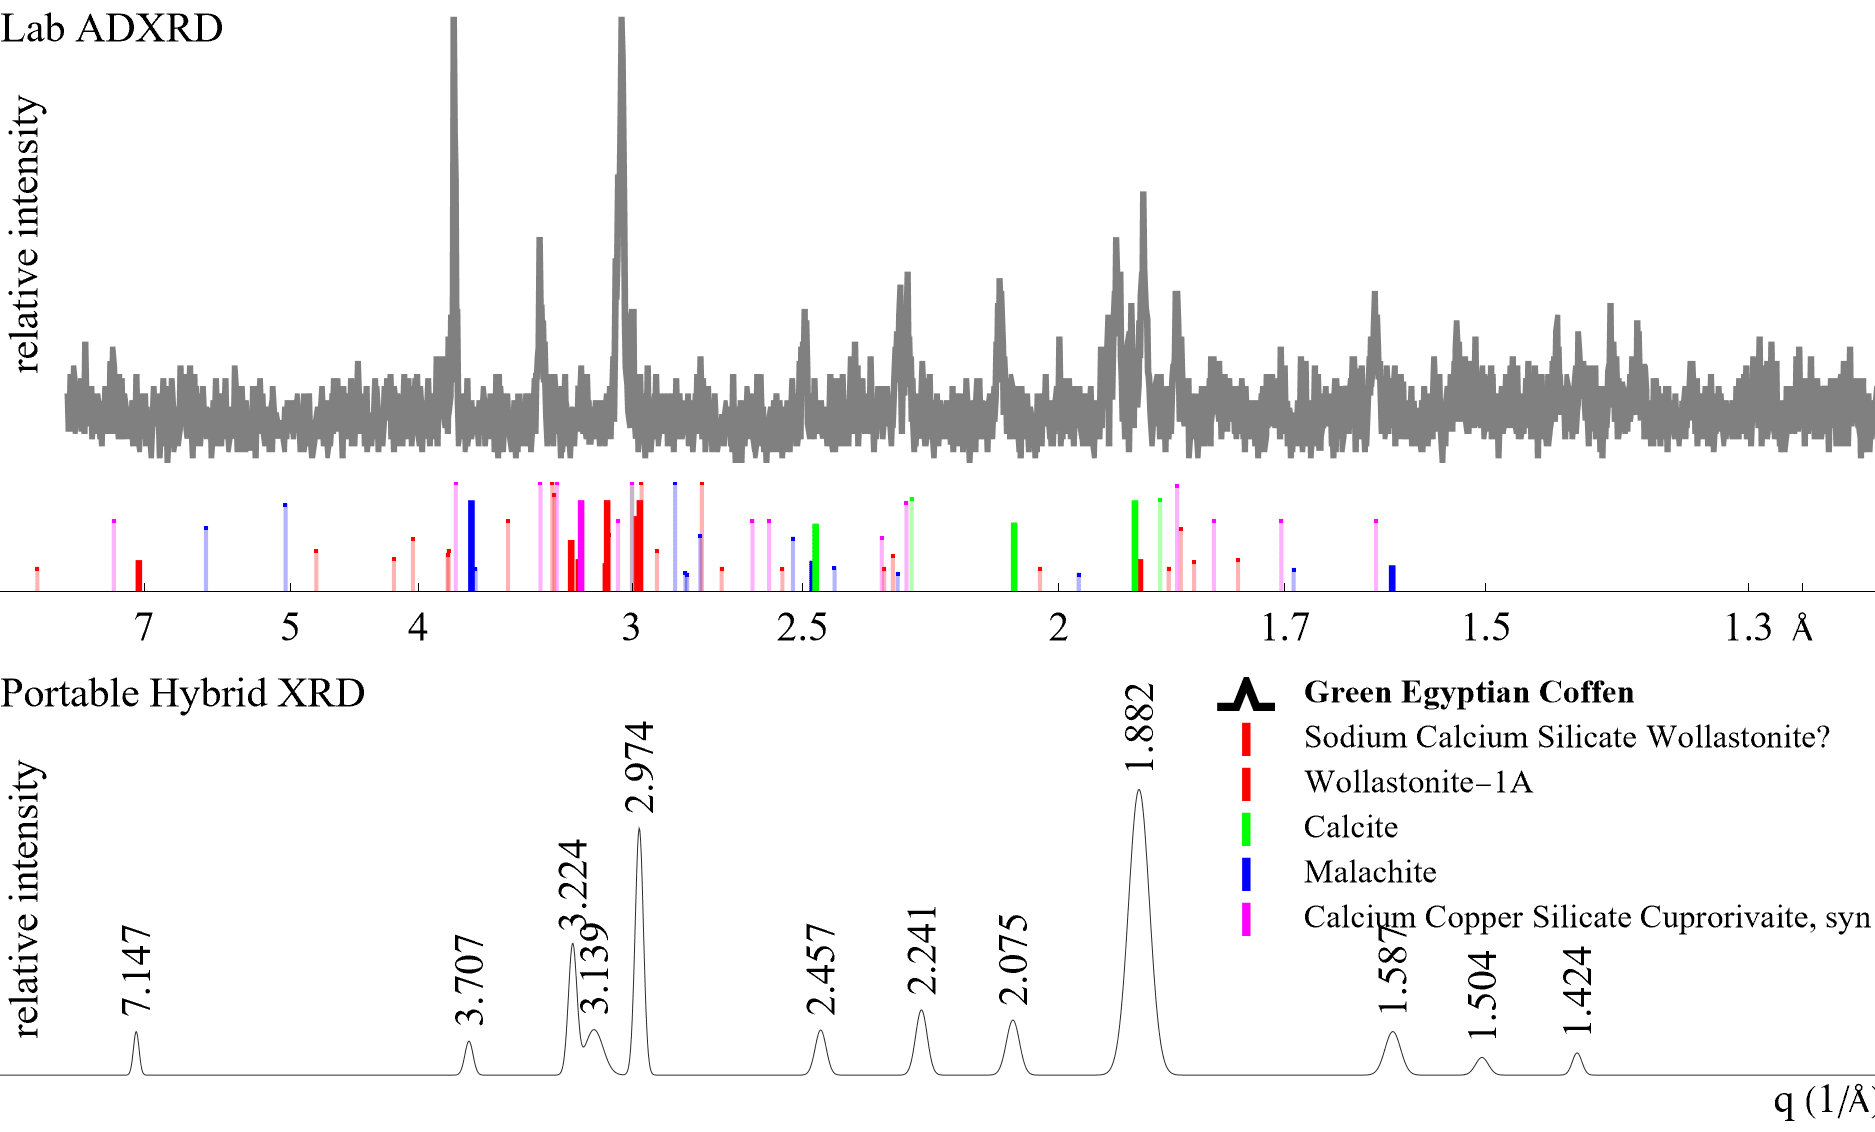
Green blue cartonnage
The Hybrid XRD analysis of a green-blue sample from cartonnage, Figure 5(b) has the strongest peak at 3.58 Å overlapping a wollastonite intense line (3.32 Å, 3.52 Å) and the additional contribution of calcite line. Cuprorivaite is identified by low-intensity peaks corresponding to its characteristic lines. The presence of wollastonite and the malachite lines, also suggested because of high Cu XRF lines, explain the green color components. The presence of cuprite and tenorite, among Cu-rich green pigments used in Ancient Egypt, was not evidenced.
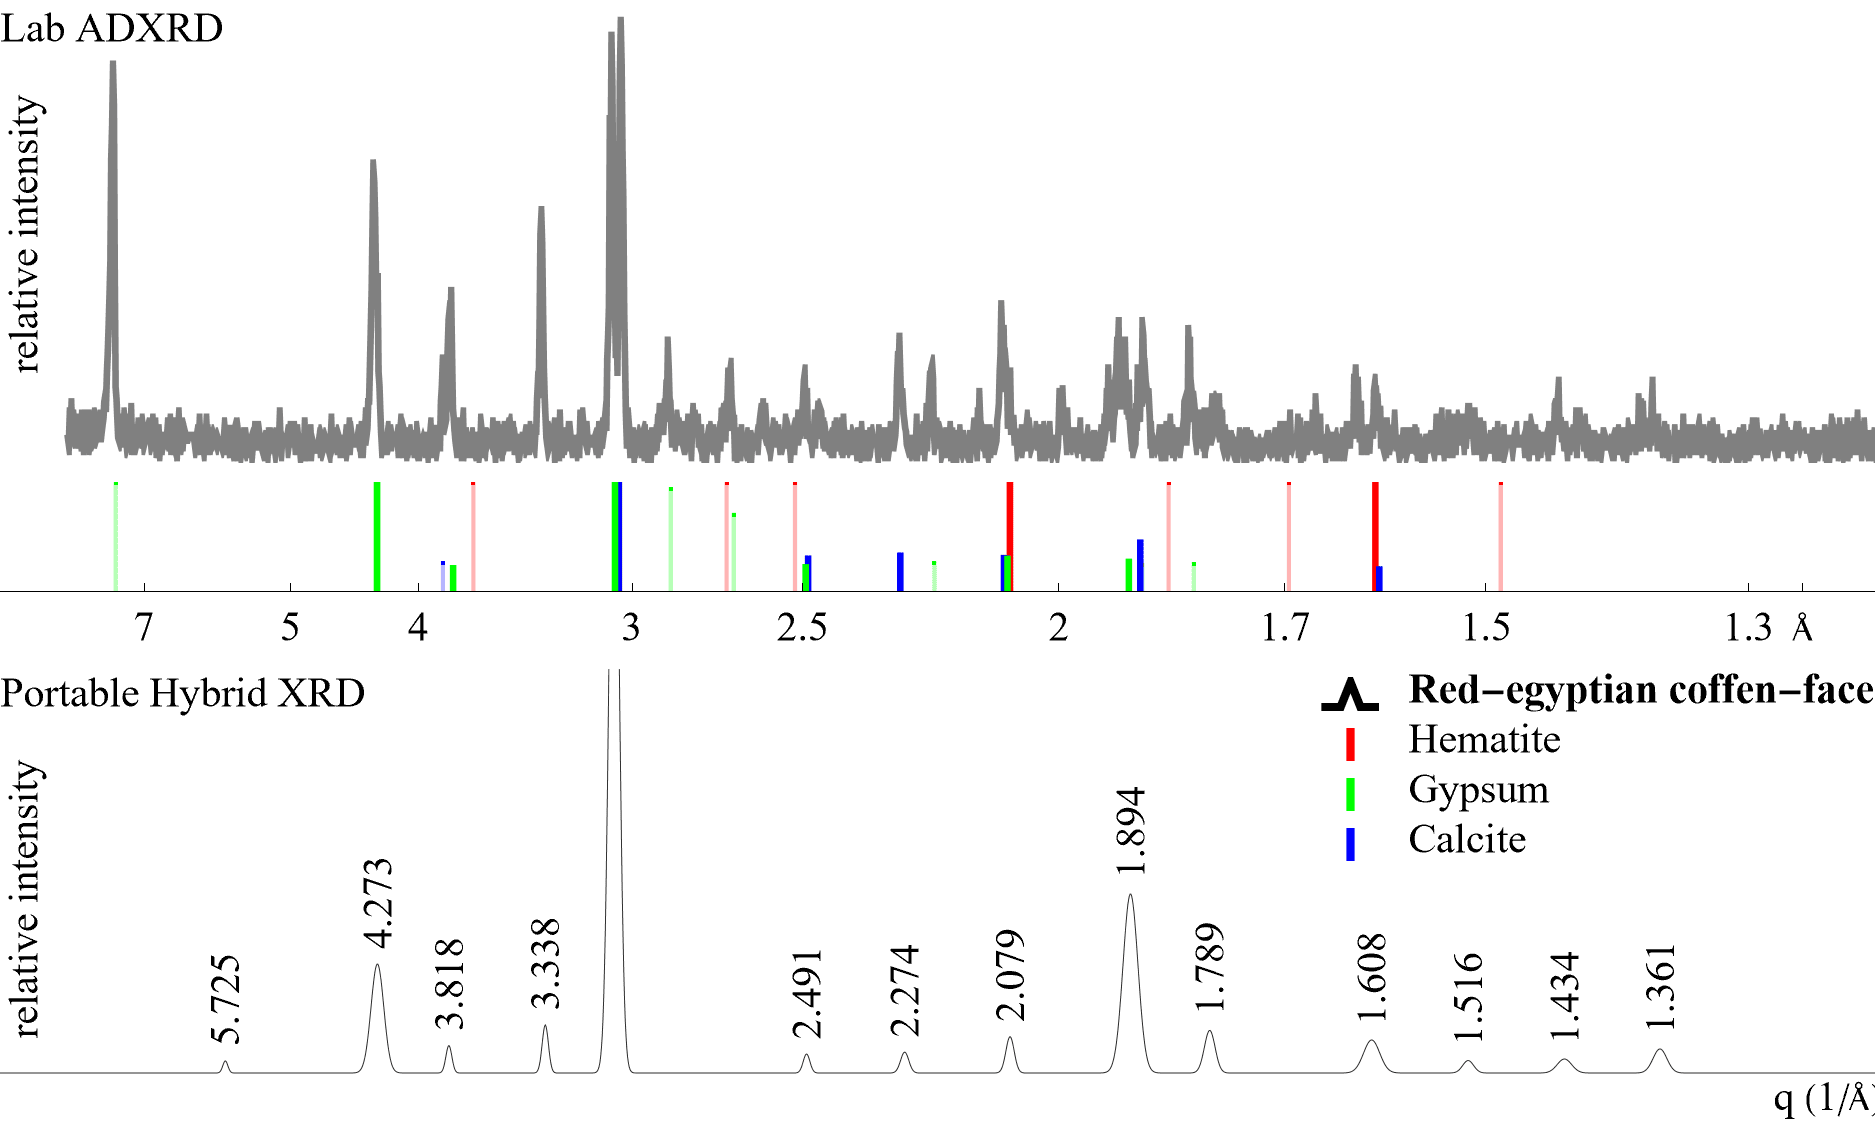
Red Egyptian of the coffin
Fe was identified in the XRF spectrum. Hematite \(\alpha\)-Fe\(_2\)O\(_3\) as red pigment in the pictorial layer was detected by weak XRD lines. Crystallinity of hematite is not strong and paint layer of this samples is thin, which produce weak XRD signal of hematite. An intense Line of gypsum at 4.27 Å, Figure 5(c), was identified that probably corresponds to the exposed preparation layer area.
(a)
(b)
(c)
Yellow-red of cartonnage
In the XRF spectrum of the yellow-red cartonnage sample, the line at 10.5 keV coincides with k\(\alpha\) line of As and the L\(\alpha\) line of Pb. Signals of orpiment (As\(_2\)S\(_3\)) are not identified in the XRD spectra, meanwhile, the presence of Pb L\(\alpha\) and L\(\alpha\) lines in the XRF signal suggests the presence of Minium, Figure 6.
The presence of Fe in the XRF spectrum suggests the use of yellow ochre (goethite). Two layers of structure in the Ariplot (XRD signal) were identified in this analyzed portion. Minium was found in the first layer, while calcite was found in the underlayer (second layer). The identification of these layers is discussed next.
Comparisons to laboratory-XRD
We have shown so far, the identification of pigment in paintings, and the detection of pictorial layers with the Angle/Energy dispersive hybrid of the XRD-XRF portable system. Now we compare this performance with laboratory XRD instrument, see Figure 5.
The analysis of examined samples by laboratory XRD and hybrid XRD are in good agreement. Besides the precision of the interplanar distance values determined by the hybrid XRD, should be noticed that some low d lines, present in the Hybrid XRD, are not identified by laboratory ADXRD analysis; for example, in the dark blue sample analysis, the lines at 1.396 Å and 1.263 Å are detected only by the Portable hybrid XRD-XRF. This system excites better the low d lines, including distances lower than 1 Å (not shown in Figure 5 because are not listed in the individual mineral card of available ADXRD database) compared with ADXRD. Signals lower than 1 Å are observed in the Angle vs Energy density plot and the individual diffractogram (Mendoza-Cuevas & Fernández-de-Cossio, 2016b).
Confirmation of these low \(d\) lines could provide additional source of discriminatory information for the identification of mineral. However, the higher \(d\) lines, as approximately higher than 6 Å are less efficiently excited by this hybrid configuration.
Depth profile analysis
Depth profile is assessed based on geometric reflection using the Art X Art software (Mendoza-Cuevas & Fernández-de-Cossio, 2016a), following these steps:
Fix a point in one of the more intense curves observed in the density plot;
A theoretical Bragg curve is drawn passing through a fixed intense peak.
If the point surface is in the same layer, both the theoretical and observed curve will visually fit. Otherwise, a layer’s depth correction will be needed. The corresponding angle shift correction is tuned with the gauge until both curves fit accurately. The corresponding hybrids are obtained considering the calculated angle shift. The underlying principle is readily evident from the described procedure. Model for other deep layers can be suggested by the same principle, if the iso-\(d\) curve is observed.
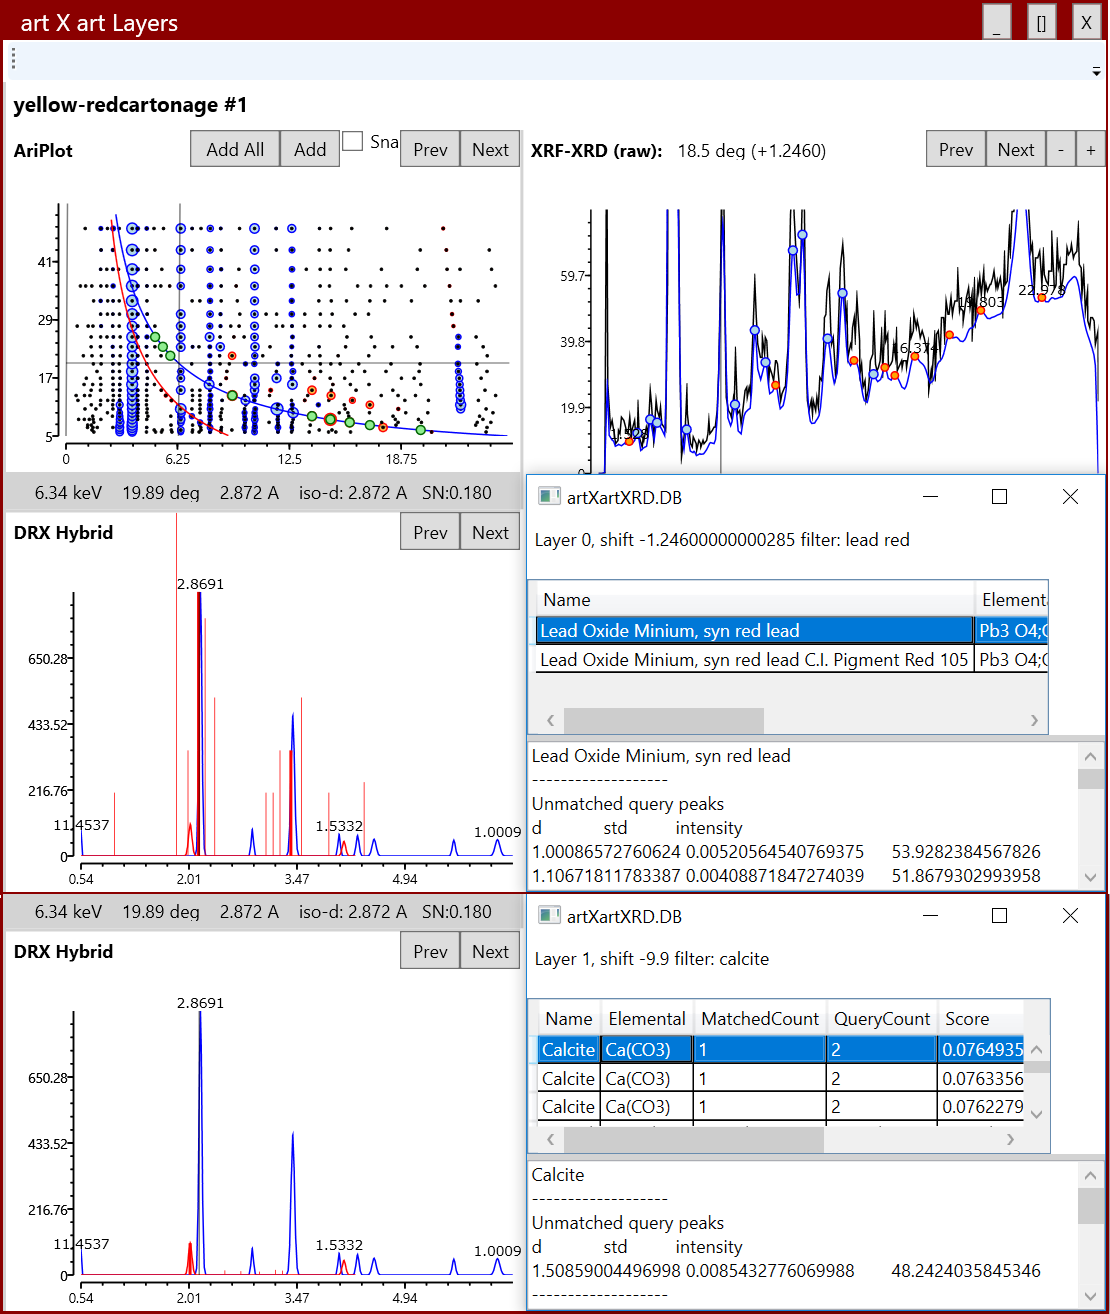
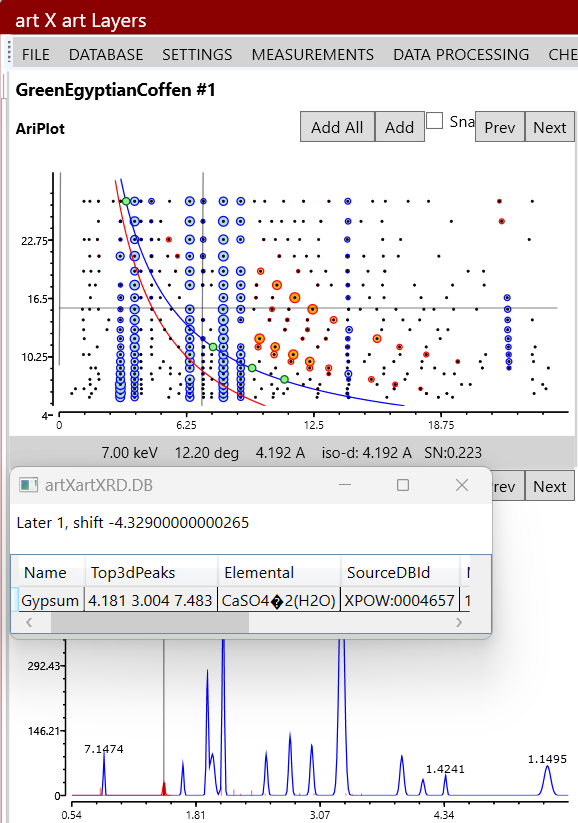
A screen dump of Art X Art displaying the identification of pigments in the layered sample of yellow-red cartonnage is shown in Figure 6.
The multi-layer identification is evident in the Ariplot, where the iso-\(d\) curve of calcite almost crosses the iso-\(d\) curves of Minium. The Minium XRD lines were identified in the exposed pictorial layer, meanwhile, calcite at 1.508 Å was identified at the underlayer. Hybrid XRD diffractograms for pictorial and preparation layers are shown as well as an example of raw ED XRD-XRF signal at 18.5° degrees. Each layer requires an angle “shift” correction for \(d\)-spacing calculation. A filter for Pb was used for the pigment identification in the database. The signal of Fe in the XRF spectra, support a light-yellow color portion in a sample, probably by the presence of goethite (\(\alpha\)-FeOOH not identified, yellow) in a deeper layer. The use of yellow ochre (goethite) was morphologically confirmed in the cross-section image by optical microscopy. The presence of Pb in the external pictorial layer was confirmed by using the available data at different angles: higher intensity of Pb is obtained for low angles.
The Ariplot, Figure 7 at the top, show the iso \(d\)-curves of different layers in the green coffin sample from the coffin. An underlayer of gypsum was apparent by the topmost XRD lines at 4.2 Å, which could account for the traditional technique of the preparation layer for the coffin.
It should be noted that the identification of the minerals in the subjacent layer depends on the maximum energy used and the X-ray absorption of the materials examined. Therefore, the minerals in the underlying layers are less efficiently excited, being identified only by their most intense lines. Future studies should approach the limits in the determination of thickness.
Prussian blue of the modeled painting
An angle dispersive X-ray diffraction portable apparatus was unable to detect this pigment in the studied paintings (Eveno et al., 2010), nor was it possible to detect it in an oil painting of the Polish Hadziewicz with a con-ventional diffractometer (Rafalska-Lasocha et al., 2011).
We identified the most intense lines of Prussian blue in our prepared modeled painting by laboratory XRD. Similar results were also obtained by other authors, in the study of Prussian blue samples in the form of powdered pigments, and in the form of blue oil, paints were investigated with the use of the X-ray powder diffraction technique, demonstrating that XRD can be valuable to suggest that this pigment was used in a blue or green (chrome green) area of a painting (Rafalska-Lasocha et al., 2011).
Besides Fe from Prussian blue, Ca, Ba, and Zn, Figure 8, are also detected in the analyzed modeled paintings by hybrid XRF spectra. The presence of Ca in painting spectra suggests calcite (CaCO\(_3\)) or gypsum (CaSO\(_4\)) use. The detection of Ba and Zn correspond to barite (BaSO\(_4\)) and zinc white (ZnO).
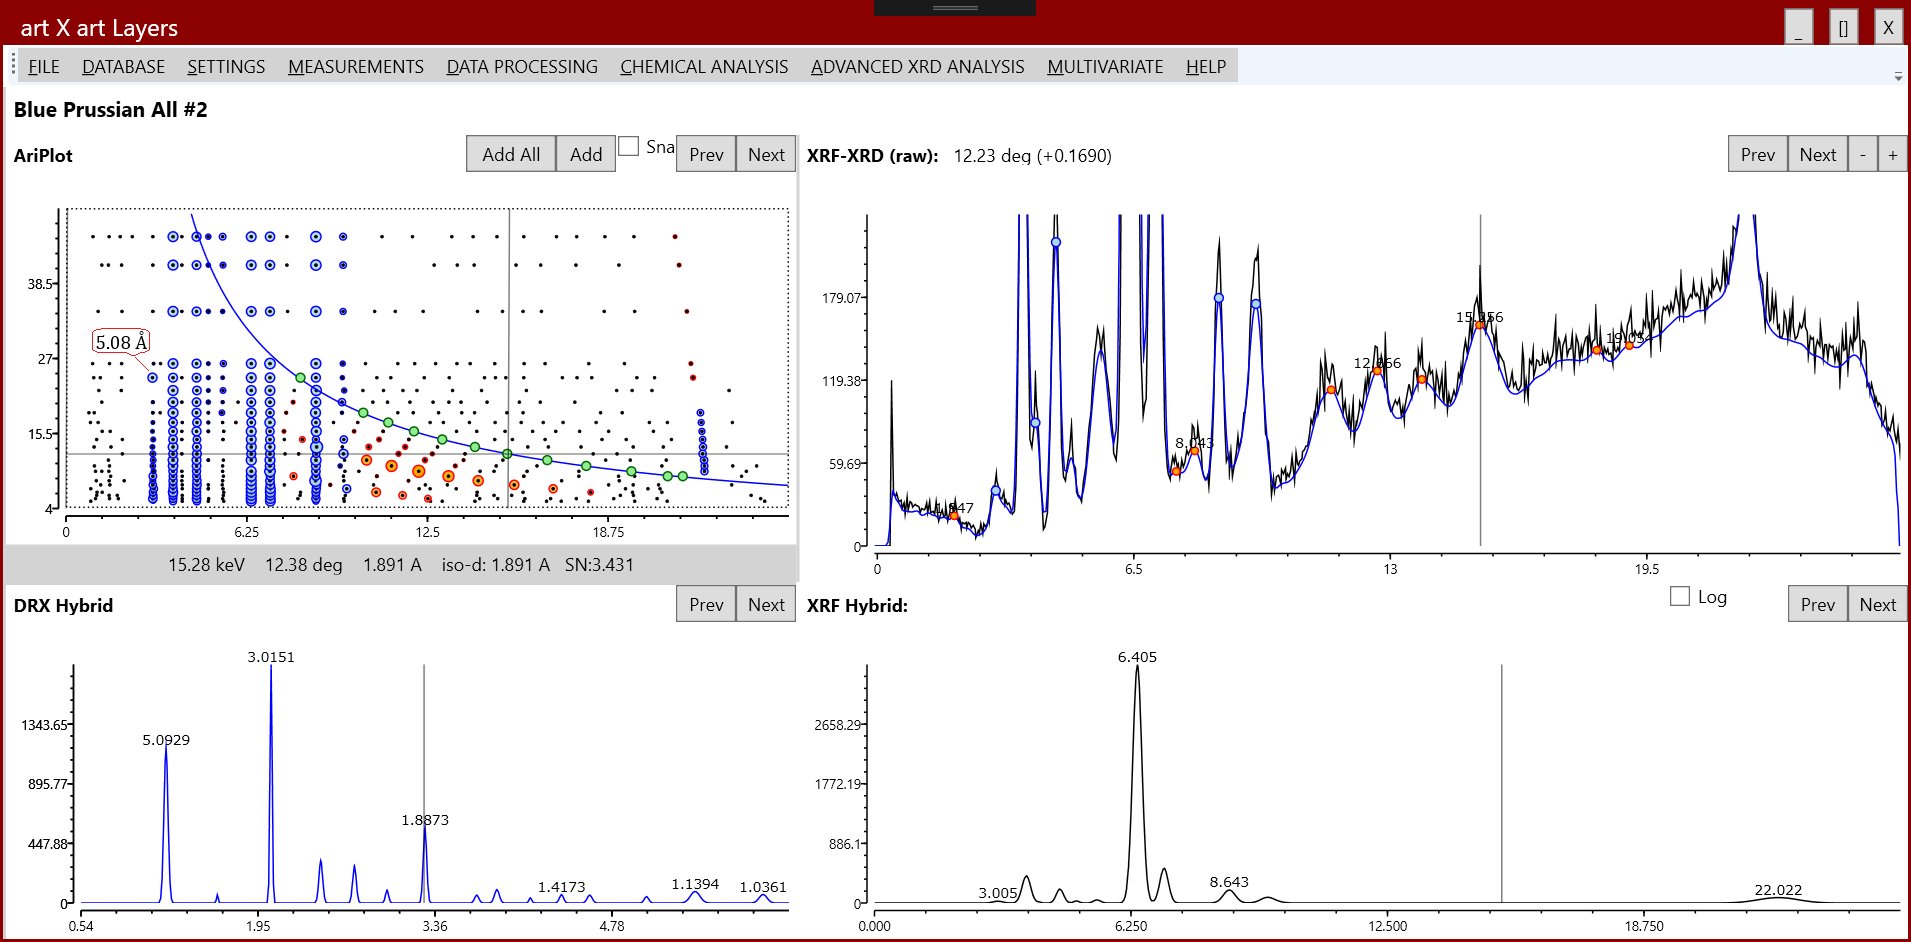
In the hybrid diffractogram obtained with the portable system of the pictorial layer on oil model painting (canvas), see Figure 8, the most intense d-spacings 5.093 Å, 3.597 Å, 2.527 Å, and 2.278 Å were detected corresponding to PDF 01/073/0689. The most intense line at 3.015 Å and 1.887 Å suggest the presence of calcite or gypsum in the thick preparation layer. The absence of lines at 7.5(6) Å and 4.26(30) Å excludes gypsum. Barite and zinc white, used as inert in commercial blue oil, enhance the lines at 3.81 Å and 3.015 Å. It should be noticed that the most intense line (5.093 Å) of Prussian blue is detected at 28° degrees, an angle easily achieved by practical geometry for the analysis of real cultural heritage artifacts. The organic component cannot be detected in the XRF spectrum of Prussian blue (Fe\(_4\)[Fe(CN)\(_6\)]\(_3\) xH\(_2\)O). However, a notable concentration of Fe can be recognized.
Conclusions
The sensitivity of the hybrid AED XRD-XRF system based on dedicated data processing developed and implemented in the Art X Art software is demonstrated for the non-invasive study of pictorial artworks.
The identification of difficult pigments like Prussian blue (typically not identified by Portable XRF or XRD systems), in the surface pictorial layer of modeled paintings, was successfully carried, differentiating their corresponding more intense XRD lines.
The performance of the low-power hybrid ED XRD-XRF portable system, demonstrated here, for the study of pictorial layer structure and the non-invasive identification of pigments in pictorial artworks, shows the potential of this setup for archaeometry research. The presented portable system offers the possibility of a sufficiently sensitive, fast and in situ non-invasive simultaneous XRD-XRF analysis at the same sample point, with an economical, compact and versatile experimental setup for the identification of minerals in pigments, gems and stones constituents of tangible cultural heritage such as polychromes, manuscripts, sculptures, and others cultural assets, as well as the characterization of the crystallinity of other materials of archaeometrical interest, and can be useful in chemometric analysis due to the reduction of XRD measurement time. The current technological advancements in energy dispersive detectors, promise in the near future to adhere this type of portable system with enhanced resolution, now in the exclusive domain of laboratory and synchrotron facilities, harnessing from the in situ rapid detections currently exhibited by the portable system in the field of applications.
Author contributions
A. Mendoza-Cuevas participated in the: Conceptualization, Data Curation, Formal Analysis, Investigation, Funding Acquisition, Investigation, Methodology, Project Managements, Resources, Programs, Supervision, Validation, Visualization, Writing – preparation of the original draft, revision and editing. J. Fernández-de-Cossio participated in the: Data Curation, Formal Analysis, Methodology, Resource, Programs, Visualization, Writing – revision and editing N. Ali participated in the: Writing – revision and editing. D. M. Atwa participated in the: Investigation, Resources, Writing – revision and editing.
Financing
The ED data was measured at the Multidisciplinary Laboratory facilities at the International Center for Theoretical Physics (ICTP). The AD data where measured at the Department of Laser Interaction with Matters, Laser Institute for Research and Applications, Beni Suef University, Egypt. The methods and software for processing the hybrid XRD-XRF data were developed at the Archaeometry Laboratory, in Havana Historian’s Office. These works were developed in the frame of IAEA-ARCAL projects RLA058 and RLA1019. The Archaeometry Laboratory acknowledge IAEA project RLA058 for the funding provided for the replacement of the X-ray tube of our portable XRD-XRF system.
Conflicts of interest
The authors declare no conflict of interest.
Acknowledgments
The data was measured in the Multidisciplinary Laboratory facilities at the International Center for Theoretical Physics (ICTP). AMC is grateful to Prof. Dr. John Niemela, Head of the Multidisciplinary Laboratory, for allowing the author to carry out the EDXRD measurements, and for encouraging this research. The methods and software for processing the hybrid XRD-XRF data were developed at the Archaeometry Laboratory, in Havana Historian’s Office. These works were developed in the frame of IAEA-ARCAL projects RLA058 and RLA1019. The Archaeometry Laboratory is grateful to IAEA project RLA058 for the support provided for the replacement of the X-ray tube of our portable XRD-XRF system.
References
Anderson, E., Almond, M. J., Matthews, W., Cinque, G. & Frogley, M. D. (2014). Analysis of Red Pigments from the Neolithic sites of Çatalhöyük in Turkey and Sheikh-e Abad in Iran. Spectrochimica Acta Part A: Molecular and Biomolecular Spectroscopy, 131, 373–383. https://doi.org/10.1016/j.saa.2014.03.126
Bonizzoni, L., Caglio, S., Galli, A. & Poldi, G. (2008). A non-invasive method to detect stratigraphy, thicknesses, and pigment concentration of pictorial multilayers based on EDXRF and vis-RS: In situ applications. Applied Physics A, 92(1), 203–210. https://doi.org/10.1007/s00339-008-4482-6
Brunetti, B., Miliani, C., Rosi, F., Doherty, B., Monico, L., Romani, A. & Sgamellotti, A. (2016). Non-invasive Investigations of Paintings by Portable Instrumentation: The MOLAB Experience. 374(1), 10. https://doi.org/10.1007/s41061-015-0008-9
Colomban, P. (2012). The on-site/remote Raman analysis with mobile instruments: A review of drawbacks and success in cultural heritage studies and other associated fields. Journal of Raman Spectroscopy, 43(11), 1529–1535. https://doi.org/10.1002/jrs.4042
de Viguerie, L., Beck, L., Salomon, J., Pichon, L., & Walter, P. H. (2009). Composition of Renaissance Paint Layers: Simultaneous Particle Induced X-ray Emission and Backscattering Spectrometry. Analytical Chemistry, 81(19), 7960–7966. https://doi.org/10.1021/ac901141v
de Viguerie, L., Walter, P., Laval, E., Mottin, B., & Solé, V. A. (2010). Revealing the sfumato Technique of Leonardo da Vinci by X-Ray Fluorescence Spectroscopy. Angewandte Chemie International Edition, 49(35), 6125–6128. https://doi.org/10.1002/anie.201001116
Downs, R. T., & Hall-Wallace, M. (2003). The American Mineralogist crystal structure database. American Mineralogist, 88, 247–250. https://api.semanticscholar.org/CorpusID:39137936
Eveno, M., Duran, A., & Castaing, J. (2010). A portable X-ray diffraction apparatus for in situ analyses of masters’ paintings. Applied Physics A, 100(3), 577–584. https://doi.org/10.1007/s00339-010-5641-0
Gianoncelli, A., Castaing, J., Ortega, L., Dooryhée, E., Salomon, J., Walter, P., Hodeau, J.-L., & Bordet, P. (2008). A portable instrument for in situ determination of the chemical and phase compositions of cultural heritage objects. X-Ray Spectrometry, 37(4), 418–423. https://doi.org/10.1002/xrs.1025
Ivanov, I. G., Popudribko, N. N., Pjatygina, N. G., Firsova, V. A. & Fundamensky, V. S. (1995). PDWIN-windows program package for X-ray polycrystal analysis. http://kfes-117.karlov.mff.cuni.cz/ecm-cd/ecm/abstract/all/612.htm
Jaksch, H., Seipel, W., Weiner, K. L., & Goresy, A. E. (1983). Egyptian blue? Cuprorivaite a window to ancient Egyptian technology. Naturwissenschaften, 70(11), 525–535. https://doi.org/10.1007/BF00376668
Kaiser, D. L., & Watters, R. L. (2010). Standard Reference Material® 660b. Line Position and Line Shape Standard for Powder Diffraction. https://11bm.xray.aps.anl.gov/documents/NISTSRM/NIST_SRM_660b_LaB6.pdf
Kämpfe, B., Luczak, F., & Michel, B. (2005). Energy Dispersive X-Ray Diffraction. Particle & Particle Systems Characterization, 22(6), 391–396. https://doi.org/10.1002/ppsc.200501007
Lambert, J. B. (Ed.). (1984). Archaeological Chemistry—III (Vol. 205). American Chemical Society. https://doi.org/10.1021/ba-1984-0205
Mendoza-Cuevas, A. (2019). Las técnicas nucleares en un enfoque no invasivo para el estudio arqueo-métrico de bienes culturales cubanos. Nucleus, 66, 11. https://doi.org/http://nucleus.cubaenergia.cu/index.php/nucleus/article/view/683/
Mendoza-Cuevas, A., Bernardini, F., Gianoncelli, A., & Tuniz, C. (2015). Energy dispersive X-ray diffraction and fluorescence portable system for cultural heritage applications: Portable ED-XRF-XRD system for cultural heritage. X-Ray Spectrometry, 44(3), 105–115. https://doi.org/10.1002/xrs.2585
Mendoza-Cuevas, A., & Fernández-de-Cossio, J. (2016a). Hybrid-angle-energy dispersive low-power X-ray diffraction and fluorescence portable system for non-invasive study: Peak identification and object positioning corrections. Microchemical Journal, 124, 235–240. https://doi.org/10.1016/j.microc.2015.08.008
Mendoza-Cuevas, Antonio & Fernández-de-Cossio, Juan (2016b). Performance of hybrid angle-energy dispersive X-ray diffraction and fluorescence portable system for non-invasive surface-mineral identification in Archaeometry. ArXiv:1610.06295 [Physics]. https://doi.org/10.48550/arXiv.1610.06295
Mendoza-Cuevas, A., & Perez Gravie, H. (2011). Portable energy dispersive X-ray fluorescence and X-ray diffraction and radiography system for archaeometry. Nuclear Instruments and Methods in Physics Research Section A: Accelerators, Spectrometers, Detectors and Associated Equipment, 633(1), 72–78. https://doi.org/10.1016/j.nima.2010.12.178
Pizzo, Benedetto, Pecoraro, Elisa & Macchioni, Nicola (2013). A New Method to Quantitatively Evaluate the Chemical Composition of Waterlogged Wood by Means of Attenuated Total Reflectance Fourier Transform Infrared (ATR FT-IR) Measurements Carried Out on Wet Material. Applied Spectroscopy, 67(5), 553–562. https://doi.org/10.1366/12-06819
Rafalska-Łasocha, A., Podulka, K., & Łasocha, W. (2011). XRPD investigations of “Prussian blue” artists’ pigment. Powder Diffraction, 26(1), 39–47. https://doi.org/10.1154/1.3554269
Rehren, T. H. (2008). A review of factors affecting the composition of early Egyptian glasses and faience: Alkali and alkali earth oxides. Journal of Archaeological Science, 35(5), 1345–1354. https://doi.org/10.1016/j.jas.2007.09.005
Salvadó, N., Butí, S., Tobin, M. J., Pantos, E., Prag, J. N. W., & Pradell, T. (2005). Advantages of the Use of SR-FT-IR Microspectroscopy: Applications to Cultural Heritage. Analytical Chemistry, 77(11), 3444–3451. https://doi.org/10.1021/ac050126k
Scardi, P., Ermrich, M., Fitch, A., Huang, E.-W., Jardin, R., Kuzel, R., Leineweber, A., Mendoza-Cuevas, A., Misture, S. T., Rebuffi, L., & Schimpf, C. (2018). Size–strain separation in diffraction line profile analysis. Journal of Applied Crystallography, 51(3), 831–843. https://doi.org/10.1107/S1600576718005411
Uda, M., Demortier, G., & Nakai, I. (Eds.). (2005). X-rays for archaeology. Springer.
Visual C: # (USPTO S/N 78014060). (2000). [Computer software]. Microsoft Corporation.
Wolfram Mathematica: (Version 13). (2021). [Computer software]. Wolfram Research, Inc. https://www.wolfram.com/mathematica