
Analysis of the Impact of the Pandemic on Social Inequalities in Enem 2019 and 2020 using Machine Learning
Macedo, B. da S.; Saporetti, C. M.
DOI 10.5433/1679-0375.2023.v44.48234
Citation Semin., Ciênc. Exatas Tecnol. 2023, v. 44: e48234
Abstract:
ENEM measures the ability and knowledge of students who are in high school or have already completed it. With the scores obtained in the exam, the student can enroll in SISU, which is one way to enter public universities. During pandemic, the planning of schools, mainly public, was affected so that many students gave up taking the ENEM in 2020. To identify the profile of those enrolled in ENEM and verify which portion was most affected, this research analyze their social inequalities using data from ENEM 2019 and 2020 and machine learning methods. The methodology is based on cluster analysis where \(K\)-Means was applied and on performance classification where Random Forest, \(K\)-Nearest Neighbors, and MultiLayer Perceptron were used, and Select \(K\)-Best was used to select features. The results of the grouping generated two groups, one composed of subscribers with lower financial conditions and another with greater ones. In the classification, the MultiLayer Perceptron obtained an accuracy of 85.18% for 2019 and 83.63% for 2020. The results showed that the proposed methodology was able to identify the differences between the subscribers and classify their performance.
Keywords: ENEM, machine learning, pandemic, social inequalities
Introduction
The National Secondary Education Examination (Exame Nacional do Ensino Médio - ENEM) was created by the Ministry of Education (MEC) in 1998, with the aim of measuring the ability and knowledge of students who have completed or are still in secondary education. The ENEM is submitted by MEC to help the school build student learning. Since its inception, ENEM has aimed to be more than just a diagnostic assessment of the portrait of Brazilian education, but also to lead individuals to make choices according to their abilities. In addition, it is used as a complementary or substitute exam for other exams to enter the job market and higher education (Santos, 2011).
Currently, ENEM has been used for other purposes, such as qualifying and attributing a similarity of learning to secondary education, serving as a requirement to provide scholarships and support to finance undergraduate courses on private networks. The ENEM, due to the particularities pointed out, makes countless students plan to enter higher institutions through it (Viggiano & Mattos, 2013).
In 2009, ENEM gained another proportion with the creation of the Unified Selection System (Sistema de Seleçio Unificada - SISU). Before, the test had 63 questions in one day, but it was modified, now having 180 questions divided into two days, with mandatory writing (Viggiano & Mattos, 2013).
SISU was created with the aim of reducing expenses with tests of dispersed selections, as well as reducing the number of inactive vacancies. It allows the democratization of entry into higher education and the expansion of students’ geographic mobility. Actually, most universities began to use the SISU completely or partially as an entrance exam. Through SISU, a "matching mechanism" is carried out by candidates, in which candidates check the vacancies available at each university and their chances of approval (Ariovaldo & Nogueira, 2018). As a result of this fact, an increase in the number of registrants present at ENEM even occurred in 2020, when, because of the pandemic, many gave up taking the test.
In the context of the pandemic, which resulted from coronavirus (Sars-CoV-2), and the interruption of face-to-face classes in the Brazilian national territory, the students were caught up in impatience, suffering, and insecurity. All planning had to be redone in Brazilian public schools throughout the COVID-19 pandemic because structurally there was a need for electronic equipment and professionals prepared for digital media. However, there was a lack of internet to allow students to interact. These factors constituted barriers and distancing from the proposal of remote education in the pandemic as a preparation for students for ENEM (Cristo, 2020).
Therefore, it can be observed that analyzing ENEM data can provide insights into the performance of students in the exam and the impact of the socioeconomic situation on it. To assess whether the pandemic contributed to a decrease in the scores of people with lower income or even caused them to give up taking the exam.
Because the ENEM database contains a large amount of information, performing global analysis and crossing the data visually becomes unfeasible. To work around this situation, machine learning techniques can be used to automate this task and generate results that allow evaluation of the differences and similarities between the participants.
In this context, the objective of this work was to analyze the profile of people who took the ENEM 2019 and 2020 tests, based on their performance. From this, we identified the possible influence of the pandemic scenario through characteristics that indicate social inequality. This analysis was performed using machine learning methods.
Related works
Several researchers have studied the identification of social inequalities in ENEM. In these works, analysis is carried out and tools are proposed in the context of Data Mining to understand the problem and seek solutions to predict the results.
Silva et al., 2014 conducted a study on ENEM 2010 on the socioeconomic data of students in the Southeast region of Brazil. The Apriori algorithm was used to discover patterns from the obtained results. The results indicate that 53% of students who completed high school in public schools, had grades below average. In addition, if the parents studied only up to the first grade, the students grades tended to be below average.
In the Gomes et al., 2017 study, the ENEM 2013 and 2014 bases for the Northeast region and the state of Pernambuco were considered. In data mining, the Weka software was used with the Apriori algorithm to discover the connections within the database. The results obtained showed that female students converge to minimum and average notes. In addition, there is a considerable link between public school students in candidates household income and their performance in exams.
Simon & Cazella, 2017 used the ENEM 2015 database to create a model to predict student performance in the natural sciences test and its technologies based on the j48 decision tree algorithm. The algorithm was able to predict 77.02% of the samples correctly out of 15998 samples. The most important variables for prediction were the type of school and the socioeconomic level of the students.
Stearns et al., 2017 applied the AdaBoost and Gradient Boosting regression algorithms with Particle Swarm Optimization to predict the performance of ENEM 2014 inscribes. Socioeconomic information was used as input data. Gradient Boosting was the algorithm that obtained the best results, having a Mean Absolute Percentage Error (MAE) of 65.90 and a R-Squared (\(R^2\)) of 0.35.
The work by Alves et al., 2018 discusses the use of the Naive Bayes and J48 algorithms through the Weka software to predict the performance of students in the Mathematics and its Technologies test through the ENEM 2015 database, using the J48 algorithm, obtaining an accuracy of 71.9%. Therefore, the attributes that resulted in the greatest impact for the algorithms were:
DEPENDENCY\(\_\)ADMINISTRATIVE;
INDICATOR\(\_\)DE\(\_\)LEVEL\(\_\)SOCIOECONOMICO;
CATEGORIZATION\(\_\)RATE\(\_\)DE\(\_\)PARTICIPATION.
Silva et al., 2020, conducted a study to identify performance and social inequalities in the analysis of students of Minas Gerais who took the ENEM in 2019. The \(K\)-Means grouping algorithm and the Apriori algorithm, which focused on Association Rules, were used to identify the level of affinity between the elements of the database. Eighty rules were generated aiming at the socioeconomic variables to characterize the clusters. The results indicate that for most of the students from state schools, the family income was less than R$ 2,000 reais. In addition, there is a relationship between students who obtained a low average score on the test for studying in public schools. Another issue is the strong relationship between color/race and monthly family income.
In Carmo et al., 2020, the results of ENEM 2019, in the state of Rio Grande do Sul, were explored. A comparison and analysis of the educational and socioeconomic profile of students who fit in the 5% worst and best averages in the state was made. To perform the analysis, graphical presentation techniques were used using the Python programing language. From the analysis carried out, the influence of the socioeconomic profile on the performance of students can be evidenced. The higher the family income, the better the result. Furthermore, students without the Internet are in the group with the worst averages that exceed 10%. Finally, among the best results, less than 1% of students did not have access to the Internet. The best results stand out for students from the federal and private networks.
Franco et al., 2020 presented applications using variable selection and classification algorithms to predict the twenty main characteristics that contribute to the good or bad performance of students in the ENEM from 1998 to 2019. The algorithm that obtained the best result in the classification was XGBoost, with an average accuracy of 80.85%.
In the Banni et al., 2021 work, the data of the ENEM 2018 from all over Brazil was used. In addition, Educational Data Mining was used with data visualization methods. To identify the characteristics most related to student performance, Machine Learning models were used for prediction. In the results, the algorithm that obtained the best result was Logistic Regression, with an accuracy of 80%. Finally, a strong relationship was noticed between socioeconomic variables and student performance.
Maia et al., 2021 used unsupervised learning in ENEM 2018 data to analyze the socioeconomic conditions of candidates using the characteristics evaluated for adherence to quotas. Information from 1537 randomly selected individuals was used.
Weber Neto et al., 2022 realized a data exploratory analysis of the ENEM 2019 and 2020 for Ceará, Maranhio e Piauí states. Results presented an improvement in the general performance of the states, a decrease in the number of inscribes who did show up for the exam, and an increase in inequality between participants from public and private institutions.
Materials and methods
In this section the steps to reach the search result are described. The databases chosen for analysis, pre-processing, and feature selection performed. Clustering analysis, in which the method used to obtain groups according to the economic situation of those inscribed is exposed. Then, classification algorithms are used to predict, according to the selected characteristics, whether the student obtained a good or inferior performance.
Database
The ENEM 2019 and 2020 databases were used for analysis. The 2019 database contains 5,095,171 samples, whereas the 2020 database contains 5,783,109 samples. Both have 76 attributes. However, 48 characteristics considered related according to the objective were analyzed, such as age group, sex, marital status, color/race, nationality, monthly family income, type of high school and type of institution that completed or will complete education medium, among others.
Pre-processing
During pre-processing, all rows that had columns with empty values were removed. This step was performed before selecting the 48 attributes. Thus, the ENEM 2019 and 2020 databases had 909,170 and 520,737 samples, respectively. Only those who answered all the questions were considered for analysis.
Posteriorly, removal that occurred were the variables that would not influence the analysis in view of the research objective (out of 76 attributes, the base had 48 as previously mentioned).
Subsequently, another treatment was performed to transform some variables using the Label Encoder method for numerical transformation of the classes of a variable. For example, the sex attribute that has M (Male) and F (Female) as possibilities was transformed into 1 and 0, respectively. Another approach used was Ordinal Encoder for numerical transformation while preserving the order of categorical data. As an example, attribute Q024, which is about whether the student has a computer at home, which has categories A (No), B (Yes, one), C (Yes, two), D (Yes, three), and E (Yes, four or more), were transformed to 0, 1, 2, 3, and 4, respectively.
The monthly family income variable was modified, with class A earning more than 20 minimum wages, class B more than 10, class C from 4 to 10, class D from 2 to 4, and class E being those with incomes of at most 2 minimum wages. Finally, a class column was added to the data, in which this attribute contains the average of the notes obtained by the students in the ENEM, transformed into 1 for good performance and 0 for poor performance.
Researchers Adeodato, 2016 and Adeodato & Silva, 2020 justified that students in the upper quartile of the average good perform well. In this work, this methodology was followed, in which the student’s performance is the simple average of the five tests that compromise the exam. This is done according to the comparison made with the value of the third quartile of the notes, i.e., the value corresponding to 75% of the notes. If the value is higher than the third quartile, the value 1 will be assigned, indicating good performance; otherwise, a value of 0 will be assigned, indicating inferior performance.
Feature selection
The Select \(K\)-Best feature selection method was applied to identify the most important features among those available in the databases. The selected characteristics served as input for the classifiers, to predict the results.
Reducing the dimension of attributes is one of the ways to remove information that is not fundamental, to increase the accuracy of learning and have a better understanding of the result. Selecting attributes is one of the simplest ways to reduce the size of a data set, because only a small number, compared to the original, of features remain (Almeida, 2021).
The method used to select the variables is Select \(K\)-Best, which employs the univariate selection strategy, which, through statistical tests, verifies the relationship of a target variable with each variable.
The \(\chi^2\) (chi-square) was the univariate statistical test used. Another parameter passed is the \(K\) value, which signifies the number of selected features. The technique performs a score in the calculation of each attribute and in the removal of each attribute as well, except for those with the highest score up to the limit of \(K\) (Almeida, 2021). The \(\chi^2\) is calculated by equation (1):
(1)
\[ \chi^2 = \dfrac{{(O - E)}^{2}}{E},\]
where \(O\) represents the noted frequency and \(E\) represents the expected class frequency, if there is no relationship between the attribute and the target attribute. The attributes are independent if the analyzed frequency is close to the noted frequency. Variables are selected for algorithm training based on the highest score of the variable with the target variable, indicating a strong relationship (Almeida, 2021).
In the cluster analysis, the algorithm used was \(K\)-Means. The method separates the data into \(K\) groups. Assume the first \(K\) centers of the clusters that are proposed, which can be chosen at random or initialized with some sample from the database (Jain & Dubes, 1988). Furthermore, each data point is assigned to the center it is closest to, creating a data cluster, then all centers are moved to the middle position of their clusters. This is repeated until equilibrium is reached (Sinaga & Yang, 2020).
The objective of the \(K\)-Means algorithm is to minimize the sum of the squared error over all \(K\) groups (Palma, 2018), given by equation (2):
(2)
\[ J(p,c)={\sum\limits_{j=1}^{K} \sum\limits_{p_i \in x_i} d(p_i,c_j) ^ {2}},\]
where \(x\) is a \(p\) dataset, \(d\) represents the distance in that dataset, and the \(c\) represents the centroid that is the center of each cluster.
One of the problems associated with the method under analysis is that not all values of \(K\) present satisfactory groups. Therefore, the method is applied several times for different values of \(K\), choosing the results that present a better interpretation of the groups or a better graphical representation or using some validation criteria (Palma, 2018).
The validation criterion used to help decide on the group number was the Silhouette Method (Peter, 1987). Silhouette analysis refers to the method of interpreting and confirming the consistency of groups of data. The silhouette value indicates how similar an object is to its cluster (cohesion) compared to other clusters (separation). This can be used to examine the separation distance between the resulting clusters. The silhouette validation technique calculates the silhouette index for each sample, the average silhouette for each group, and the total average silhouette for the dataset. Each group can represent itself by an index based on a comparison of its rigidity and dissociation when applying this method. If the silhouette value is high, the object fits well in its own cluster and poorly in the neighboring cluster. The silhouette coefficient is calculated using the mean intra-cluster distance \(a\) and the mean distance to the nearest cluster \(b\) for each sample \(i\). The silhouette coefficient is calculated as shown in equation (3):
(3)
\[ {s(i)} = \dfrac{{b(i) - a(i)}}{{max(a(i), b(i))}}\]
where,
\(a(i)\) is the average dissimilarity of the \(i\)th object to all other objects in the same cluster.
\(b(i)\) is the average dissimilarity of the \(i\)th object to all objects in the closest cluster.
Therefore, if the silhouette value is close to 1, the sample is well grouped and has already been assigned an appropriate grouping. If the silhouette coefficient value is approximately 0, the sampling can be assigned to another cluster closer to it and the sample is equally far from both clusters. This means that it indicates that the groupings are juxtaposed. Finally, if the silhouette value is close to -1, the sample was misclassified and placed somewhere between the clusters (Maciel et al., 2015).
Classification
To perform the classification process, the data must be divided into training and test sets. The holdout cross-validation method was employed, in which the data were divided over a predetermined percentage, where the training percentage was greater than the test (Oxford & Daniel, 2001). The value for dividing the set was the value of 75% of the data for training and 25% for testing.
Three classification algorithms were employed and compared: Multilayer Perceptron, \(K\)-Nearest Neighbors, and Random Forest. Multilayer Perceptron Networks (MLP) were created to solve non-linearly separable problems, i.e., problems cannot be separated by a hyperplane. It has an input layer for data, one or more hidden layers for processing information through activation functions, and an output layer for the result. It is a feed-forward-type network, in which it is fully connected and each neuron of the next layer receives the output of the previous neurons (S., 2001). In the input layer of an MLP network, the initial attributes are inserted as information. The output layer is the result is presented and where a possible error in this solution is determined. In the network training phase, the neuron weights are changed so that the calculation results in the expected solution. Errors are minimized using the Backpropagation algorithm in this phase (Lima et al., 2016). Figure 1 shows an example of an MLP neural network architecture with an input layer, two hidden layers, and an output layer.

\(K\)-Nearest Neighbors (KNN) stores a set of training samples, this set being the so-called "instance" of the problem. When a new sample is sent to the classifier, it returns an answer based on the ratio of the new sample to the training set. It assumes that sampling corresponds to points in an \(n\)-dimensional space, where "\(n\)" is the number of descriptors used to represent the sampling. For classification, it identifies a new sample called "neighborhood", that is, the closest already known points ([cover1967nearest - not found]).
The Random Forest (RF) is a supervised learning algorithm that is formed by a set of decision trees that are built when the model is trained. In the construction, some variables inside the feature vector are randomly chosen.
Therefore, the entropy of each variable is calculated, and the one with the highest value is used to separate the classes at that position in the tree. The classifier’s solution is pointed to of the class that was returned as a result by most of the trees in the forest (Breiman, 2001).
Moreover, the algorithm can avoid overfitting and converging on an error. Furthermore, the more complex the model becomes, the more solutions are provided for prediction and the importance of each of the attributes in the final model is evidenced (Souza et al., 2019).
To evaluate the classification methods, accuracy, precision, f1-score, and recall were measured. Accuracy (AC) measures how close the obtained result is to the true class, thus, the higher the accuracy level, the greater the classifier’s ability to correctly identify the classes, as shown in the equation (4):
(4)
\[ \text{AC} = \frac{1}{N}\sum^N_{i=1}I(f(x_i)=y_i),\]
where \(f(x_i)\) is the class returned by the classifier and \(y_i\) is the true class of the sample. Consider \(I(true) = 1\) and \(I(false)=0\).
Precision (Pr) represents the rate of Predicted Positive (PP) cases that are correctly identified as True Positives (TP), and it is defined by
(5)
\[ \text{Pr} = \dfrac{TP}{PP}.\]
The Recall (Re), given by
(6)
\[ \text{Re} = \dfrac{TP}{TP + FN},\]
measures the percentage of actual positive samples that were classified as positive. In equation (6), \(TP\) represents the number of true positives, and \(FN\) represents the number of false negatives.
The F1 score, equation (7), is written as
(7)
\[ \text{F1} = \dfrac{2 TP}{2TP + FP + FN},\]
where \(TP\) is the number of positive samples that were correctly classified, \(FP\) is the number of negative samples classified as positive, and \(FN\) is the number of positive samples classified as negative.
Results and discussion
Computational experiments were performed using implementations based on the pandas and scikit-learn framework libraries. All experiments were run on a computer with the following specifications: Intel(R) Core(TM) i5-1135G7, 8 GB RAM, and Windows 10 operating system. The processing time for sorting was approximately 13 min and for clustering was 3 h (search for the best number of clusters and clustering).
In the cluster analysis, the K-Means was applied, varying the number of clusters from 2 to 6. Thus, the number of groups adopted corresponds to the highest value of the silhouette coefficient, which is for each variation of the number of clusters. For the 2019 base, the highest coefficient value was approximately 0.463 for the number of clusters equal to 2. As for the 2020 base, the highest coefficient value was approximately 0.464 for the number of clusters equal 2.
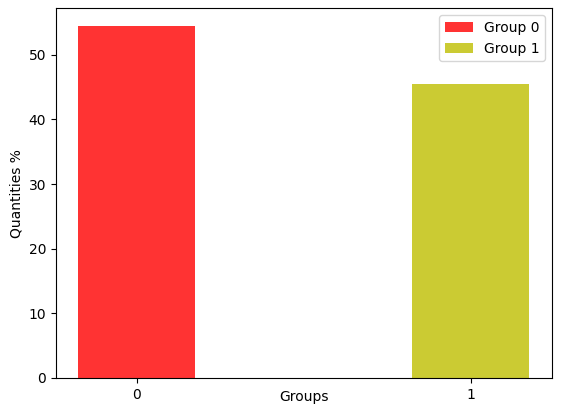
Figure 2 shows the distribution of people in groups based on notes. In the two years, 2019 and 2020, the following distribution of groups was found: Group 0 is concentrated on students with poor performance in ENEM, while Group 1 is students with good performance. Based on family monthly income, most of the students who did not perform well, the monthly family income is a maximum of two minimum wages and belong to public
school.
| (a) |
 |
| (b) |
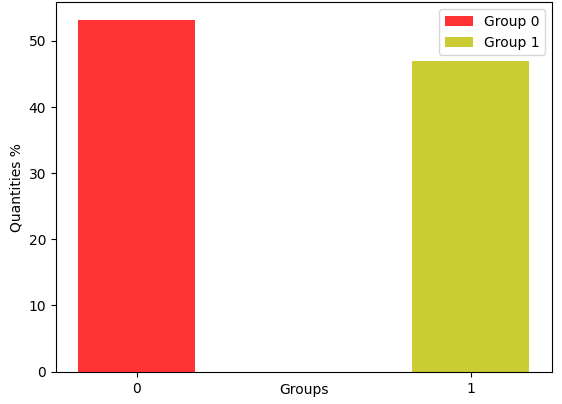 |
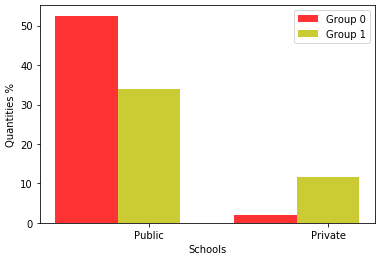
Figure 3 shows the division of clusters for high school categories for the 2019 and 2020 data. When compared with 2019, Group 0 had the highest number of participants from a public school and Group 1 had the largest number of participants from a private school.
Similarly, for the 2020 baseline, Group 0 had the highest number of public school students, and Group 1 had the highest number of private school students.
It is noticed that the decrease in the number of participants, compared 2019 to 2020. This fact is directly related to the pandemic, as the vast majority of public school students did not have asynchronous classes, as happened in private schools. This made learning difficult, causing many to give up taking the ENEM in that year.
| (a) |
 |
| (b) |
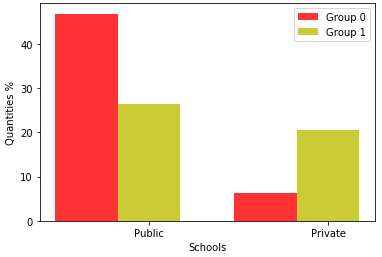 |
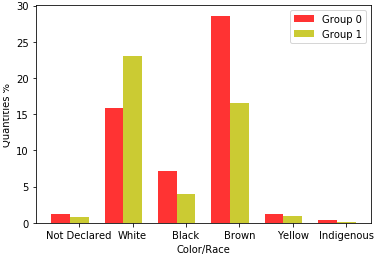
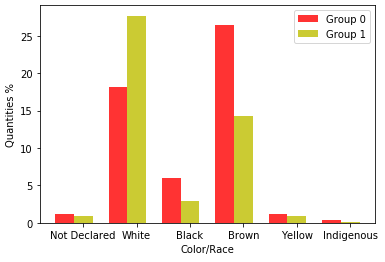
Figure 4 shows the color/race attributes in the databases.
| (a) |
 |
| (b) |
 |
For 2019, Group 0 had the highest number of brown, yellow, indigenous, and black students, and Group 1 had the highest number of white students.
In the 2020 baseline, a behavior similar to that of 2019 is observed in terms of the distribution of subscribers in relation to the groups found and race. Prevailing in Group 0 was greater number of brown, yellow, indigenous, and black students, and in Group 1 was the highest number of white students.
It can be seen that the percentage of people who declare themselves black or brown decreases from 2019 to 2020, which indicates a decrease in the presence of these people in the tests. It was conjectured that most of these people came from public schools that did not have remote classes, which contributed to the withdrawal of ENEM.
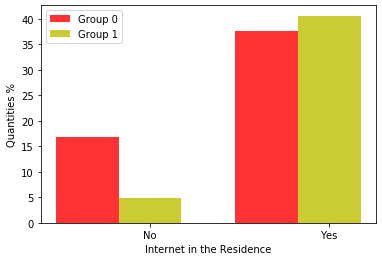
Figure 5 shows graphs regarding internet access at home. In both years, the majority of those enrolled in both groups had internet at home, but analyzing the percentage of those without internet, the majority belongs to Group 0.
| (a) |
 |
| (b) |
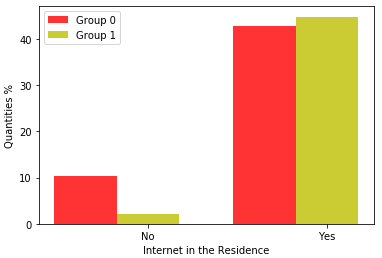 |
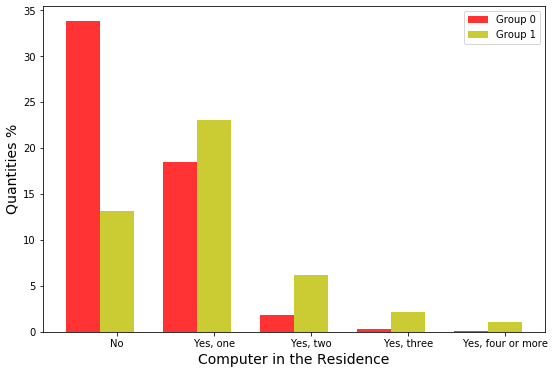
Figure 6 displays information on whether or not the participant has a computer at home, and in the case of so, how many computers they have. In Group 0, in 2019, most do not have one, and in Group 1, most students have a computer, but a small proportion have more than one computer.
| (a) |
 |
| (b) |
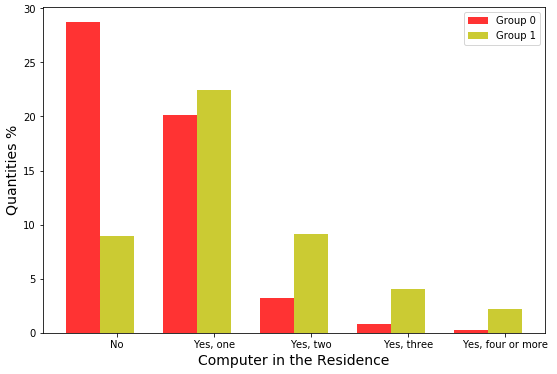 |
In both 2019 and 2020, it was observed that most students in Group 0 do not have a computer, and if they do have a computer, most only have one. Most Group 1 students have a computer at home.
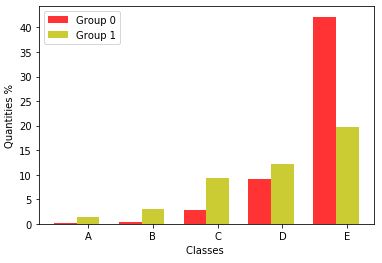
Figure 7 displays the family’s monthly income class.
| (a) |
 |
| (b) |
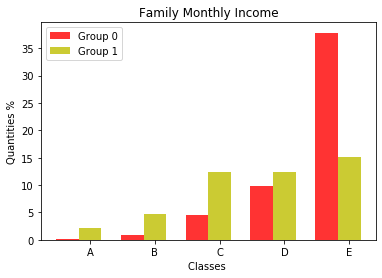 |
For 2019, in Group 0, the monthly family income of most students is a maximum of two minimum wages, i.e., they belong to class E. In Group 1, most students are in class E to a lesser extent. In the other classes, they have Group 1 students with less frequency, but the difference is not as significant as that in Group 0. The same is observed for 2020. In addition, the difference between the number of students in classes C (4 to 10 minimum wages), D (2 to 4 minimum wages), and E decreases for Group 1.
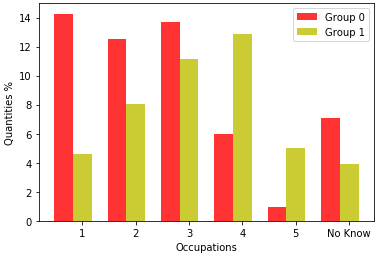
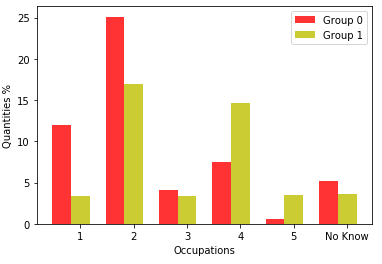
Figure 8 shows the occupation of the father or responsible man.
| (a) |
 |
| (b) |
 |
For 2019, Group 0 has most of the occupations belonging to Occupation 1, which is a farmer, farmer without employees, cold boiá, animal breeder, beekeeper, fisherman, lumberjack, rubber tapper, or extractive; Occupation 2 in which is a day laborer, domestic worker, caregiver for the elderly, nanny, cook, private driver, gardener, cleaner for companies and buildings, security guard, doorman, postman, office boy, salesman, cashier, store attendant, administrative assistant, receptionist, servant mason or stocker of goods, and belonging to Occupation 3, where he is a baker, industrial cook or in restaurants, shoemaker, seamstress, jeweler, mechanic lathe, machine operator, welder, factory worker, mining worker, mason, painter, electrician, plumber, driver, truck driver, or taxi driver. Group 1, on the other hand, has the highest number in Occupation 4, in which it is a teacher (elementary or high school, language, music, arts, etc.), technician (nursing, accounting, electronics, etc.), police officer, military low rank (soldier, corporal, sergeant), realtor, supervisor, manager, shepherd, micro-entrepreneur (owner of a company with less than 10 employees), small tradesman, small landowner, or self-employed.
On the 2020 basis, Group 0 has the most people in Occupations 1, 2, and 3, and Group 1 has the most people in Occupation 4, in a similar way to the year 2019.
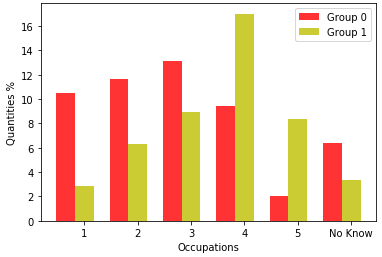
Figure 9 shows the occupation of the responsible mother or woman.
| (a) |
 |
| (b) |
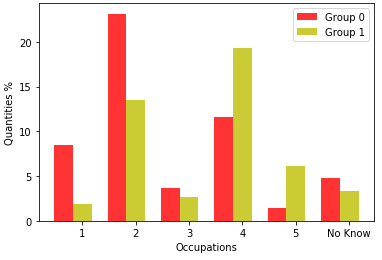 |
Group 0 at the basis of 2019, the largest occupation belongs to Occupation 2, which is a day laborer, maid, caregiver for the elderly, nanny, cook (in private homes), private driver, gardener, cleaning company and buildings, security guard, concierge, wallet, office-boy, saleswoman, cashier, store attendant, administrative assistant, receptionist, mason’s servant, and merchandise stocker.
In Group 1, most of the occupations belong to Occupation 2 and Occupation 4 in which she is a teacher (elementary or high school, language, music, arts, etc.), technician (nursing, accounting, electronics, etc.), police officer, low-ranking military (soldier, corporal, sergeant), real estate broker, supervisor, manager, pastor, micro-entrepreneur (owner of a company with less than 10 employees), small trader, small landowner, self-employed or self-employed. However, for 2020, Group 1 had the highest number of occupations belonging to Occupation 4, followed by Occupation 2. In addition, Group 0 had the highest number of occupations in Occupation 2.
Therefore, it can be seen that in the two cases, most of the students who did not perform well in the ENEM, belonged to a public school, were brown/brown, did not have a car, did not have a computer at home, and a salary at the maximum 2 minimum wages, represented by Group 0 in the 2019 basis and by Group 1 in the 2020. In addition, the occupation of the father or responsible man belongs to Occupations 1, 2, and 3. However, for the occupation of the mother or responsible woman, a large part of Occupation 2.
The students with good performance, a large part are from private school, white color/race, with a computer at home, monthly family income of class C where the minimum wages are from 4 to 10, class D in which minimum wages are 2 to 4, and class E of up to 2 minimum wages. Yet, these students with good performance had a car in their homes. In addition, it was noticed that a decrease in the number of subscribers presented with lower financial conditions, thus missing the opportunities, highlighted in the Introduction, for which the ENEM score can be used.
In the classification of student performance, the 20 variables selected by the Select \(K\)-Best method in the 2019 database to carry out the classification were the acronym of the school’s federation unit, administrative department (School), the acronym of the federation unit of the application of the test, foreign language, writing test note, up to which note the father, or the man responsible for the student studied, until which note the mother, or the woman responsible for the student studied, and the occupation of the father, or the man responsible for the student. In addition, the occupation of the mother or the woman responsible for the student, the monthly income of the family, if the residence works as a domestic worker, bathroom in the residence, car in the residence, if the residence has a freezer (independent or second refrigerator door), if the residence has a microwave oven, if the residence has a vacuum cleaner, color television in the residence, cable TV, landline telephone, and if it has a computer in the residence.
For the 2020 basis, the same attributes were selected using the Select \(K\)-Best method, except forof one attribute, if the residence has a microwave oven. Instead, the method selected the attribute if the house has a dishwasher. Most of the selected characteristics are factors that indicate social inequality among subscribers. As shown in Tables 1 and 2, the MLP, KNN, and RF algorithms were applied to predict student performance based on notes for 2019 and 2020, respectively.
| Classifier | Accuracy | F1-score | Precision | Recall |
|---|---|---|---|---|
| MLP | 0.8518 | 0.8439 | 0.8457 | 0.8518 |
| KNN | 0.8218 | 0.8173 | 0.6660 | 0.8218 |
| RF | 0.8193 | 0.7882 | 0.8524 | 0.8193 |
| Classifier | Accuracy | F1-score | Precision | Recall |
|---|---|---|---|---|
| MLP | 0.8363 | 0.8275 | 0.8278 | 0.8275 |
| KNN | 0.8051 | 0.8013 | 0.8051 | 0.6236 |
| RF | 0.8060 | 0.7715 | 0.7946 | 0.8060 |
The algorithm that obtained the best accuracy in both databases was MLP, with 85.18% and 83.63% accuracy, respectively. The other metrics also show that MLP led to the best performance.
Conclusions
Access to higher education is a desire of many young people, and achieving good performance on ENEM is important to achieve this goal. However, social inequalities impose invisible barriers on most of these young people, and the pandemic has increased these inequalities, affecting the people who took the exams. Therefore, analyzing performance on the exam from a socioeconomic perspective is important to support discussions on how to prevent the maintenance of this inequality.
This paper presents a methodology based on machine learning to identify social inequalities in the face of subscribers who took the ENEM test in the years 2019 and 2020. The choice of these years was to verify if there was an impact of the pandemic on the exam inscribers. To achieve this objective, a methodology based on cluster analysis and classification was proposed. In the cluster analysis, the \(K\)-Means method was applied, where two clusters were identified, one focused on those enrolled with low income and another with higher income. The fact that the method managed to achieve this separation shows how much the characteristics differ between the groups. This clarification regarding clusters was confirmed through the analysis of some characteristics. From the analysis conducted, it was found that in 2020, many public-school students, considering the subscribers presents, failed to take the ENEM test. This factor is related to the fact that during the pandemic, these students were without classes.
Regarding classification, the Select K-Best method was initially applied to identify the most important characteristics, which serve as input for the algorithms. The selected characteristics are related to the measurement of social inequality. Subsequently, the results of the RF, MLP, and KNN algorithms were compared, with MLP being the algorithm that presented the best result for the bases, with an accuracy of 85.18% for 2019 and 83.63% for 2020.
Author contributions
B. da S. Macedo participated in the: data curation, formal analysis, investigation, visualization, programs, writing original draft, revision and editing. C. M. Saporetti participated in the: supervision, conceptualization, methodology, writing original draft, revision and editing.
Conflicts of interest
The authors have no conflicts of interest to declare.
Acknowledgments
The authors wish to thank the Polythenic Institute and State University of Minas Gerais for their support.
References
Adeodato, P. J. & Silva, R. L. C., F. (2020). Where to aim? Factors that influence the performance of Brazilian secondary schools. In Anna N. Rafferty, Jacob Whitehill, Violetta Cavalli-Sforza, & Cristobal Romero (Eds.), International Conference on Educational Data Mining (EDM 2020) [Conference]. Proceedings of The 13th International Conference on Educational Data Mining (EDM 2020)..
Adeodato, P. J. (2016). Data mining solution for assessing Brazilian secondary school quality based on ENEM and census data. In Contecsi International Conference on Information Systems and Technology Management [Conference]. 13th Contecsi, Sao Paulo, Brazil.
Almeida, D. S. S. (2021). Saude digital: predicao do risco de reinternacao em hospitais universitarios federais [Dissertaçio de Mestrado, Universidade Católica de Brasília]. Biblioteca Digital.
Alves, R. D., Cechinel, C. & Queiroga, E. (2018). Prediçio do Desempenho de Matemática e Suas Tecnologias do Enem Utilizando Técnicas deMineraçio de Dados. In Universidade Federal de Sio Carlos,Congresso Brasileiro de Informática na Educaçio [Congresso]. 7º Congresso Brasileiro de Informatica na Educaçio, Sio Carlos, Brasil.
Ariovaldo, Thainara Cristina de Castro & Nogueira, Claudio Marques Martins (2018). Nova forma de acesso ao ensino superior publico: um estado do conhecimento sobre o Sistema de Selecao Unificada-SISU. Universidade Estadual de Campinas (UNICAMP). 4(1), 152--174.
Banni, Maicon Ribeiro, Oliveira, Marcos Vinicius dos P & Bernardini, Flavia Cristina (2021). Uma analise experimental usando mineracao de dados educacionais sobre os dados do enem para identificacao de causas do desempenho dos estudantes. In Sociedade Brasileira de Computaçio, Anais do II Workshop sobre as Implicações da Computaçio na Sociedade [Workshop]. 2º Workshop sobre as Implicações da Computaçio na Sociedade, Porto Alegre, Brasil.
Breiman, L (2001). Random forests. 5--32. https://doi.org/10.1023/A:1010933404324
Carmo, Rafael Vinicios, Heckler, Wesllei Felipe & Carvalho, Juliano Varella (2020). Uma Analise do Desempenho dos Estudantes do Rio Grande do Sul no ENEM 2019. 18(2), 378--387. https://doi.org/https://doi.org/10.22456/1679-1916.110257
Cover, Thomas & Hart, Peter (1967). Nearest neighbor pattern classification. IEEE. 13(1), 21--27.
Cristo, Helio Souza (2020). A quem serve o Exame Nacional do Ensino Medio em tempos de pandemia da Covid-19 no Brasil?. 20(224), 262--273. https://doi.org/10.1109/TIT.1967.1053964
Franco, Jacinto Jose, de Almeida Miranda, Fernanda Luzia, Stiegler, Davi, Dantas, Felipe Rodrigues, Brancher, Jacques Duilio & do Carmo Nogueira, Tiago (2020). Usando Mineracao de Dados para Identificar Fatores mais Importantes do Enem dos ultimos 22 Anos. In Sociedade Brasileira de Computaçio, Anais do XXXI Simpósio Brasileiro de Informática na Educaçio [Simpósio]. 31º Simpósio Brasileiro de Informática na Educaçio, Porto Alegre, Brasil.
Gomes, Tancicleide, Gouveia, Roberta & Batista, Maria Conceicao Moraes (2017). Dados educacionais abertos: associacoes em dados dos inscritos do exame nacional do ensino medio. In Sociedade Brasileira de Computacao, Anais do XXIII Workshop de Informatica na Escola [Workshop]. 23º Workshop de Informatica na Escola, Porto Alegre, Brasil..
S. Haykin (2001). Neural Networks. Pearson.
Jain, Anil K & Dubes, Richard C (1988). Algorithms for clustering data. Prentice-Hall.
Lima, M A, Ferreira, G G, Oliveira, L L C, Diniz, R F S & Ferreira, C B (2016). Uso de redes neurais artificiais (RNA) do tipo multilayer perceptrons (MLP) modificado com processamento estatistico em paralelo para estudo do problema de classificacao da origem de vinho tinto. 6(2), 58--65. https://doi.org/10.21206/rbas.v6i2.282
Maciel, Adeline, Vinhas, Lubia & Camara, Gilberto (2015). Algoritmos de clustering para separacao de culturas agricolas e tipos de uso e cobertura da Terra utilizando dados de sensoriamento remoto. In Anais XVII Simposio Brasileiro de Sensoriamento Remoto (SBSR) [Simposio]. 17º Simposio Brasileiro de Sensoriamento Remoto, Joao Pessoa, Brasil.
Weber Neto, Nelson, Raimundo C. Soares, Luciano R. Coutinho & Ariel S. Teles (2022). Análise exploratória de dados para identificar o impacto da pandemia da COVID-19 no ENEM dos estados do Ceará, Maranhio e Piauí. In Sociedade Brasileira de Computaçio, Anais da Escola Regional de Computaçio do Ceará, Maranhio e Piauí [Anais]. 10ºEscola Regional de Computaçio do Ceará, Maranhio e Piauí, Porto Alegre, Brasil.
Oxford, Raquel M & Daniel, Larry G (2001). Basic Cross-Validation: Using the" Holdout" Method To Assess the Generalizability of Results. ERIC. 8(1), 83--89.
Palma, L (2018). Agrupamento de dados: k-médias. [Trabalho de Conclusio de Curso, Universidade Federal do Recôncavo da Bahia].
Peter J. Rousseeuw (1987). Silhouettes: A graphical aid to the interpretation and validation of cluster analysis. 53-65. https://doi.org/https://doi.org/10.1016/0377-0427(87)90125-7
Santos, J. M. C. T. (2011). Exame Nacional do Ensino Medio: entre a regulacao da qualidade do Ensino Medio e o vestibular. 195--205. https://doi.org/10.1590/S0104-40602011000200013
Silva, L. A., Morino, A. H. & Sato, T. M. C. (2014). Pratica de mineracao de dados no Exame Nacional do Ensino Medio. In Sociedade Brasileira de Computacao, Anais dos Workshops do Congresso Brasileiro de Informatica na Educacao [Workshops]. 3º Congresso Brasileiro de Informatica na Educacao, Porto Alegre, Brasil. https://doi.org/10.5753/cbie.wcbie.2014.651
Silva, V. A. A., Moreno, L. L. O., Goncalves, L. B., Soares, S. S. R. F. & Souza, R. R. Jr. (2020). Identificacao de Desigualdades Sociais a partir do desempenho dos alunos do Ensi Medio no ENEM 2019 utilizando Mineracao de Dados. In Sociedade Brasileira de Computacao, Anais do Simposio Brasileiro de informatica na Educacao [Anais]. 31º Simposio Brasileiro de Informatica na Educacao, Porto Alegre, Brasil. https://doi.org/10.5753/cbie.sbie.2020.72
Simon, A. & Cazella, S. (2017). Mineracao de dados educacionais nos resultados do ENEM de 2015. In Anais dos Workshops do Congresso Brasileiro de Informatica na Educacao [Workshops]. 6º Congresso Brasileiro de Informatica na Educacao, Porto Alegre, Brasil. https://doi.org/10.5753/cbie.wcbie.2017.754
Sinaga, Kristina P. & Yang, Miin-Shen (2020). Unsupervised K-means clustering algorithm. IEEE. 80716--80727. https://doi.org/10.1109/ACCESS.2020.2988796
Souza, Isabela Almeida, Barreto, Tarssio Brito & Esquerre, Karla Patricia Santos Oliveira Rodriguez (2019). Modelo de interpretabilidade local pautado em random forest para classificacao de usos domesticos de agua. 4(1), 12.
Stearns, B., Rangel, F., Firmino, F., Rangel, F. & Oliveira, J. (2017). Prevendo desempenho dos candidatos do ENEM atraves de dados socioeconomicos. In Anais do Concurso de Trabalhos de Iniciacao Cientifica da SBC [Anais]. 36º Concurso de Trabalhos de Iniciacao Cientifica da SBC, Porto Alegre, Brasil.
Viggiano, E. & Mattos, C. (2013). O desempenho de estudantes no Enem 2010 em diferentes regiiµes brasileiras. 417--438.
Maia, M. M., de Andrade, L. H. F., & Fernandes, S. (2021). K-means na análise de características socioeconômicas de candidatos ao ensino superior. In Universidade Federal Rural do Semi-Árido, Anais do Encontro de Computação do Oeste Potiguar ECOP/UFERSA [Anais].2º Encontro de Computação do Oeste Potiguar-Pocket, Pau dos Ferros, Brasil. https://periodicos.ufersa.edu.br/ecop/article/view/11168