
A Machine Learning Model to Automatic Assessment of Gross Motor Development in Children using Posenet
Pilati Filho, E. L.; Spinosa, R. M. O.; Brancher, J. D.
DOI 10.5433/1679-0375.2023.v44.48131
Citation Semin., Ciênc. Exatas Tecnol., 2023, v. 44: e48131
Abstract:
Gross motor skills such as sitting, jumping, and running are activities that involve the large muscles of the human body. The Test of Gross Motor Development, or TGMD, is widely used by researchers, pediatricians, physiotherapists, and educators from different countries to assess these skills in children aged 3 to 11 years. An important part of the test is that the movement, performed by the children, needs to be recorded and assessed by two or more professionals. The assessment process is laborious and takes time, and its automation is one of the main points to be developed. In recent years, methods have been proposed to automate the assessment according to the TGMD. The hypothesis investigated in this work is that it is possible to induce a machine learning model to identify whether the movement executed by the child is correct, considering only the first criterion of the TGMD-3 jumping skill. The skeleton of the children was extracted using PoseNet. A dataset of 350 images of Brazilian children between 3 and 11 years old performing the preparatory movement for the jump was used. The experimental results show an accuracy of 84%.
Keywords: automatic assessment, machine learning, motor development, TGMD-3
Introduction
The Motor development can be formally defined as changes in motor behavior that occur throughout life and the processes underlying these changes (Clark, 2005; Gallahue et al., 2013). Understanding this phenomenon, especially in children, depends on the observation and assessment of changes in these classes of movements, which implies identifying, describing, and measuring behaviors at various moments (Manoel & Connolly, 1995).
Motor development is often divided into gross motor skills and fine motor skills. The first area activities
involve the large muscles in the human body, such as sitting, jumping, walking, and running. Fine motor skills are those activities that involve smaller muscles, such as manipulating objects, grasping, and writing (Gonzalez et al., 2019).
Assessment instruments are very useful tools to monitor the general development of an individual. In kindergarten, the use of assessment tools for Fundamental Motor Skills (FMS) is essential, as it allows professionals to determine the developmental status of the child’s FMS; monitor the child’s progress in relation to motor skills programs; examine the effectiveness of the programs and ensure the adequacy between the activities carried out and the development of the child (Marques et al., 2017).
Different protocols have been developed for child motor assessment, such as the Korperkoordination Test fur Kinder (KTK) (Kiphard & Schilling, 1974), the motor development scale (Rosa, 2002), the Movement Assessment Battery for Children (MABC) (Henderson et al., 2007), the Test of Gross Motor Development (TGMD) (Ulrich, 2000; Ulrich, 2017), among others.
Out of these protocols, the TGMD stands out, as it is an instrument designed to assess the fundamental motor skills of children aged between 3 and 11 years (Ulrich, 2017) with standardized and validated procedures for the Brazilian population. The test is easy to apply and has been used for more than 30 years by researchers, pediatricians, physiotherapists, and educators from different countries, both to assess motor development levels and to assist in the planning of school intervention programs (Valentini et al., 2017).
In its third version, TGMD-3, the evaluation of 13 skills divided into two classes of movements are proposed, namely: locomotor (running, galloping, hopping on one foot, horizontally jumping, laterally running and skipping) and manipulative (dribbling, two-handed striking, one-handed striking, overhand throwing, underhand throwing, catching and kicking) (Ulrich, 2017). In order to apply the test, the evaluators must pay attention to the procedures proposed by the technical manual, which include the efficient demonstration together with the verbal instruction of the skill that will be performed, an attempt to familiarize the child and two valid attempts that will be filmed for later analysis and assessment.
Each skill has between 3 and 5 equivalent criteria that must be performed to account for the child’s performance score. Each correct criterion receives a score of 1, and each incorrect criterion receives a score of 0, generating the partial score of the motor skill. The participant’s recording is essential for the analysis stage, in which two or more specialists carefully watch all the children’s videos, observing whether the corresponding performance criteria were executed during the performance of each motor skill (Ulrich, 2017).
The 4 criteria for the jumping skill of the TGMD-3 are:
Preparatory movement includes flexion of both knees with arms extended behind the body.
Arms extend forcefully forward and upward reaching full extension above the head.
Take off and land on both feet simultaneously.
Arms are thrust downward during landing.
In the TGMD, the assessment task can become complex and susceptible to human error, since the evaluator needs to be very careful when analysing the key points of the video that correspond to the performance criteria. The amount of analysis required can be extremely time-consuming in surveys involving large samples, considering that each test participant generates 26 videos that must be scored individually. The automation of the process is a very natural and relevant way to speed up the correction process and enhance the reliability of the result.
The purpose of this work is to generate a machine learning model that is capable of identifying whether the child’s movement is correct for the first criterion of jumping skill. Through the pose recognition model PoseNet ("Estimativa", ) provided by Tensorflow (Abadi et al., 2015) it was possible to identify the points of articulation of the child’s body in images extracted from the videos, which were extracted when the child is executing the preparatory movement of the jumping skill, from the extracted points it was possible to define new features to identify if the movement was executed correctly.
Some recent works are being developed on the theme addressed in this paper.
In Suzuki et al., 2021, the authors propose a way to automate the assessment of the TGMD-3 skill criteria. The work continues with the improvement of the application developed by the authors in Suzuki et al., 2019 and in Suzuki et al., 2020, but the focus of the work is to present a proposal for diagnosing the abilities of the TGMD-3. The strategy was to use the anomaly detection technique, an unsupervised method, in which the authors trained a model with correct movements, and everything that differs from these movements is considered an anomaly.
In this way, the child’s skeleton is presented with some colors, the parts of the body where the child possibly performed the movement wrongly are presented in red. This alternative is like a heat map, it does not automatically show the score directly, it just provides the evaluator with possible points of failure in the movement performed by the child. The results indicate that it was possible to visually emphasize the points that correspond to the TGMD-3 criteria.
It is possible to verify that the work of Suzuki et al., 2021 proposes a way to facilitate the evaluation process for the professional evaluator. Despite providing a diagnosis of the movement in the form of a heat map, the automatic attribution of the grade is not performed. In this way, the importance of this paper is noted by advancing in the automation of the evaluation of the TGMD-3 criteria, in addition, the proposal of this paper does not require equipment that needs to be attached to the child during the execution of the skills, which makes it the simplest model to adopt.
In Bisi et al., 2017 to assess children’s movement competence according to TGMD-2, a study was carried out with 45 Italian children aged 6 to 10 years old. Five IMUs (inertial measurement unit) sensors were used that were mounted on the back, ankles and wrists to capture the movements.
The movements were captured on video and submitted to 3 professional evaluators to provide a score according to the TGMD-2. In parallel, an algorithm was developed for automatic analysis of videos with data captured by sensors, the results point to a reduction in time from 15 minutes to 2 minutes of evaluation, but lacks improvements in quality, showing an agreement of more than 87% when compared to the traditional assessment technique (Bisi et al., 2017). However, this technique is limited in relation to the proposal of this paper, as it is mandatory to use sensors and equipment to carry out the evaluation.
The sessions in this paper are structured as follows. The Methods section contains a description of the dataset, in addition, it includes the description of the Feature selection step. The results and discussions present the scores and some discussions related to the induced models and, subsequently, the conclusions of the work.
Methods
The experiments carried out in this paper consider only the first criterion of the TGMD-3’s jumping skill, since it is the object of study. The objective is to induce a machine learning model capable of identifying whether the preparation movement of the TGMD-3 jumping skill was performed correctly, this preparation movement only includes the first criterion.
Dataset
The videos that we used consist of Brazilian children between 3 and 11 years old performing the jumping skill of TGMD-3. The videos were recorded for the work of Spinosa, 2019 and reused in this work. Data confidentiality was maintained in accordance with the research guidelines of the work Spinosa, 2019. The study was approved by the Institutional Ethics Board under CAAE number: 75943317.6.0000.5231. The videos were submitted to the assessment of two professionals, who assigned scores to the movements. Only the videos in which there was agreement in the assessment were used, that is, the videos in which the two professionals attributed the same score for the first criterion. Being score 1 for movement performed correctly and score 0 for movement executed incorrectly.
350 videos were selected, 175 with a score of 1 and 175 with a score of 0 for the first criterion. Some videos are from the same child performing the movement, as two valid attempts per child were recorded. From these videos, images were extracted of the moment when the child prepares to jump. The images were submitted to the PoseNet pose recognition model provided by TensorFlow ("Estimativa", ).
The acquisition of the images was made by the authors,who includes a specialist. Since the moment of the preparatory movement is a window of frames, it is not difficult to acquire an image that represents the first criterion, the preparatory movement is the moment right before the child starts the impulse for the jump. The acquisition was made by a process of opening each video, identifying the moment that represents the first criterion, and extracting the image.
To achieve the extraction of the skeleton points was created an algorithm in JavaScript implementing the already trained model of PoseNet, the PoseNet model is trained with the Coco Dataset from microsoft (Lin et al., 2014). With this model is possible to recognize 17 keypoints of the human body, the implemented algorithm developed in JavaScript works by feeding the model with a loaded imagem in the browser, proceding the execution of the model allows the console of the browser to print the points of the skeleton.
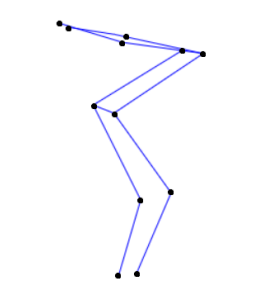
The model provides a skeleton of the human body with two coordinates for each point of articulation as shown in Figure 1. The points extracted by the model that were taken into account were the shoulders, elbows, wrists, hips, knees and ankles.
The PoseNet, Figure 1, was selected because of its accuracy in the detection of the human body, as shown in Jo & Kim, 2022, where a study was carried out to compare the PoseNet, MoveNet and OpenPose models on mobile devices. The test images were divided into three groups, the first with images containing a single person, the second group with images containing multiple people and the third group with images without any person. The third group containing images of animals and objects was adopted to identify whether any of the models estimate poses, even when there are no humans to identify in the image. The results in Jo & Kim, 2022 show that the model that was faster in estimating poses was MoveNet, while OpenPose was the slowest. The model that presented the most accuracy was PoseNet. The accuracies of OpenPose, PoseNet, MoveNet Lightning, and MoveNet Thunder were 86.2%, 97.6%, 75.1%, and 80.6%, respectively.
There are 12 points in total, 6 for the right side of the body and 6 for the left side. Each point extracted from the body receives a horizontal coordinate value and a vertical coordinate value. Coordinates are provided for both the right and left sides, so it is possible to identify the position of the articulation point in the image. The model also extracts the points that correspond to the eyes and nose, but as they are not of interest for the assessment, they were removed.
In total, 24 coordinates were extracted, representing the 12 points. The coordinates together with the score received in the criterion formed the features of the initial dataset, with the score received in the criterion being the target that should be predicted by the model.
Feature selection
The images taken from the videos do not have the same size, which implies that the coordinates of the skeletons are not reliable for training a model without first going through modeling and feature selection, as a coordinate in one image can be completely displaced in another. In addition, there were children who performed the movement from left to right, and there were children who performed from right to left. That alone, makes it impossible to use the dataset with these 24 coordinates. Another issue is that children are not the same height, so distances may vary. It was necessary to think of strategies to generate features that are proportional and represent the first criterion of the jumping skill.
From the description of the first criterion of the jumping skill, it is possible to extract two informations that resulted in obtaining the score: arms extended behind the body and knees flexed. Since only the first criterion is considered, the only points to analyse are the wrist and knee.
As all children were recorded laterally for the execution of this skill, the point that represents the shoulder was considered as the delimiter of what is in front and what is behind the child’s body. Thus, to establish whether the arms are extended behind the body, was calculated the horizontal coordinate of the shoulder minus the horizontal coordinate of the wrist, in this way it is possible to generate a positive feature for arms behind the body and negative for arms in front of the body. The calculation was done for the right side and for the left side, resulting in two new features selected for the new dataset.
In most videos, children perform the movement from left to right, however, in 18 videos, children performed from right to left. In these videos, the order of subtraction to know if the arms are behind the body was inverted, the horizontal coordinate of the wrist minus the horizontal coordinate of the shoulder. Thus, it was possible to maintain the positive feature when the arms are behind the body.
When the knees are flexed, the distance between the hip and the ankle needs to be less than the distance when the child is standing upright. To find out the hip-ankle distance when the child is in an upright posture, the Euclidean distances of the hip-knee and knee-ankle were calculated in the plane of coordinates provided by PoseNet, the two distances were added, obtained the hip-ankle distance of the child in upright posture. It
calculated the difference between the child’s hip-ankle distance in an upright posture and the hip-ankle vertical distance measured on the image. The calculation was done for the left and right sides, resulting in two new features for the new dataset.
With this calculation, it was possible to obtain two features that identify how flexed the knees are in relation to the child’s height.
After these steps, 4 new selected features were obtained, two representing whether the arm is behind the body (right and left), and two representing the flexion of the knees (right and left). These 4 new features involve only the original features that really matter for the assessment. The result was a new dataset with the 4 features and the score received in the criterion as the target, the initial dataset with all 24 coordinates was not used in training.
| Features | Side |
|---|---|
| Distance between wrist and shoulder | right |
| Distance between wrist and shoulder | left |
| Knee flexion related to child size | right |
| Knee flexion related to child size | left |
Data visualization
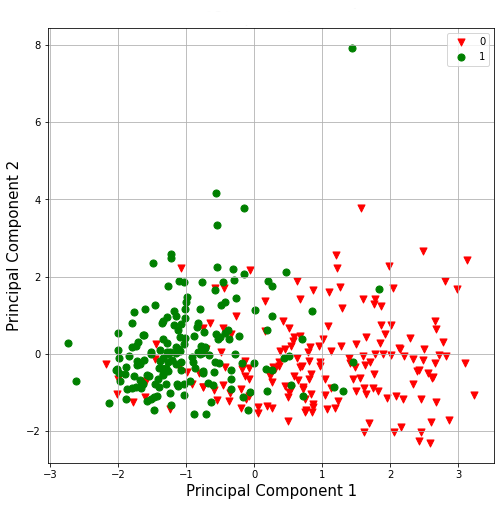
For data visualization, the Principal Component Analysis technique was used. The visualization of all data from the new features was in accordance with Figure 2. It is possible to identify two sets, a nucleus of points where the movement was done correctly (dots), that is, where the score received was 1, and another where the movement was done incorrectly (triangles), with the score 0 on the criterion. For the PCA, the new dataset with the 4 features was used.
Results and discussion
The dataset with the 4 selected features was used for the training phase, with the target to be predicted being the score received in the first criterion of the jumping ability.
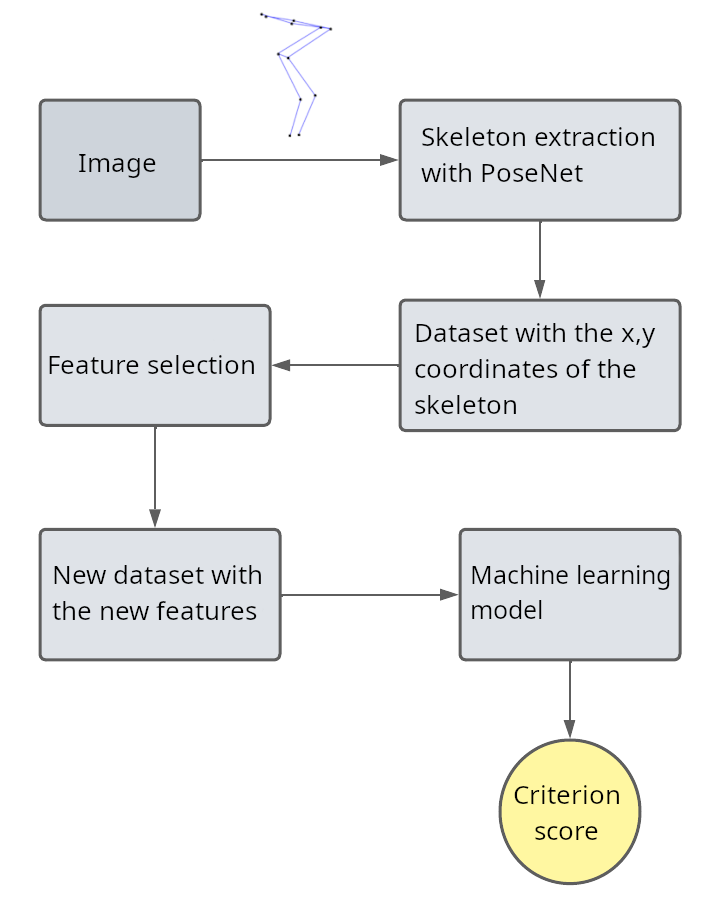
In Figure 3 it is possible to verify the entire methodological process used in this work to obtain a machine learning model capable of identifying whether the movement performed by the child is correct or wrong.
Three algorithms were chosen to induce a model capable of classifying the images in order to say whether the movement was performed correctly or not. The three selected algorithms were K-nearest neighbors, Random Forest, and One-class SVM.
The separation of training and test data was done randomly in the proportion of 60% for training, 20% for validation/test, and 20% was separated as holdout. Careful attention was taken to separate data as a holdout to evaluate the performance of the model after the training phase. The holdout, test and training data were separated in the proper proportion between the two classes 0 and 1, thus maintaining the balance of the dataset throughout the process. This resulted in 210 training images, 70 validation images, and 70 holdout images.
For the One-class SVM, the dataset with only class 1 was used, as the anomaly detection technique was used, where it is expected that the anomalies are all data from class 0. The data of the 175 images with grade 1 were randomly divided into 80% for training and 20% for testing, resulting in 140 images for training and 35 images for testing. Out of the 175 images with class 0 that were left out of training, 20% were randomly selected, generating a sub-dataset of 70 images for testing, 35 with class 1, and 35 with class 0.
For the models generated by K-nearest neighbors and Random Forest, the K-fold was used, also from sklearn (Pedregosa et al., 2011), to cross-validate the dataset, thus avoiding overfitting the models. The K-fold used divided the dataset into 5 parts. The Stratified K-fold version was used, this way, the data selected for the test part are chosen in a balanced way between the two classes 1 and 0.
For the One Class SVM model, the K-fold was not used because of the need for training only on class 1, the class 0 was not included in the training phase because the strategy used was the anomaly detection, therefore the only data that has value for training is from class 1.
In the implementation of K-nearest neighbors, it was possible to define the number k of neighbors that must be considered to predict the class of an input data. The smallest number of neighbors that provided the best results was 11 in a range of 1 to 100 neighbors tested. Furthermore, it is a good practice to use the number k of neighbors as odd, thus forcing the decision of a class if the test data is exactly on the border separating two classes.
For the K-nearest neighbors, the K-fold generated 5 machine-learning models, one for each cross-validation subdivision. Table 2 presents the results of the models generated by K-nearest neighbors in the 5 folds.
| Fold | Accuracy | Precision | Recall | F1-score |
|---|---|---|---|---|
| 1 | 0.84 | 0.84 | 0.84 | 0.84 |
| 2 | 0.89 | 0.89 | 0.89 | 0.89 |
| 2 | 0.79 | 0.79 | 0.79 | 0.78 |
| 4 | 0.84 | 0.85 | 0.84 | 0.84 |
| 5 | 0.86 | 0.86 | 0.86 | 0.86 |
The average metrics of the KNN models are as follows. An accuracy of 0.84, a precision of 0.85, a recall, and f1-score of 0.84 were obtained. The holdout sub-dataset, that is, the separate part of the dataset that was never seen by the models in the training phase, was submitted to the prediction of the 5 models. The average results presented by the models in the holdout sub-dataset were 0.85 for average accuracy, 0.90 for average precision, 0.78 for average recall, and 0.84 for average f1-score.
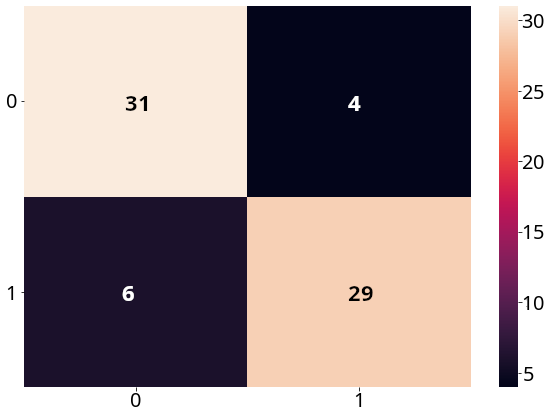
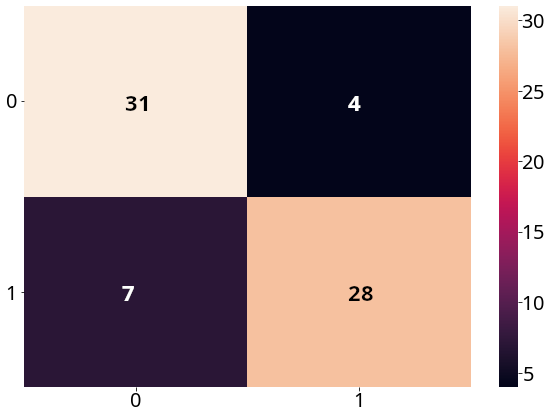
Figure 4 represents the confusion matrix of the best model generated by the K-nearest neighbors on the holdout data.
In the implementation of the Random Forest algorithm, it was possible to indicate the number of decision trees to be used, 500 decision trees were used in the algorithm, which is a reasonable number to create a model. For the Random Forest, the 5-part K-fold was also used to perform cross-validation and avoid overfitting the models. Table 3 presents the results of the models generated by Random Forest in the 5 folds.
| Fold | Accuracy | Precision | Recall | F1-score |
|---|---|---|---|---|
| 1 | 0.82 | 0.83 | 0.82 | 0.82 |
| 2 | 0.91 | 0.92 | 0.91 | 0.91 |
| 2 | 0.79 | 0.79 | 0.79 | 0.79 |
| 4 | 0.80 | 0.81 | 0.80 | 0.80 |
| 5 | 0.86 | 0.86 | 0.86 | 0.86 |
The average metrics of the Random Forest models are as follows. An accuracy of 0.84, a precision of 0.84, a recall of 0.84 and an f1-score of 0.84 were obtained. The holdout sub-dataset was submitted to the prediction of the 5 models. The average results presented by the models in the holdout sub-dataset were 0.93 of average accuracy, 0.89 of average precision, 0.75 of average recall and 0.81 of average f1-score.
Figure 5 represents the confusion matrix of the best model generated by Random Forest on the holdout data.
In the implementation of the One-class SVM, two parameters were adjusted. First, the use of the RBF kernel (Radial basis function) was defined, which is non-linear, this implies the generation of a nucleus of points that will be used to define whether the preparatory movement is correct or not. All anomalies outside the core are considered wrong movements, so only class 1 data from the dataset were used, conditioning the model to recognize everything outside of that core as wrong movement.
It was defined that a total of 20% of the training data should be considered outliers, that is, they should be outside the main core, 20% was the number that generated better results in the separation of classes for the One-class SVM.
For the One-class SVM algorithm, 50 iterations were performed, in each iteration a new training and test set was randomly drawn in the same proportion in which they were initially divided, that is, 80% for training and 20% for testing, always adding to the test data 20% of data with class 0 also randomly selected.
For the model generated by One-class SVM the average accuracy was 0.77, precision 0.77, recall 0.79 and the average f1-score was 0.77.
The results obtained demonstrate the possibility of generating a model that is capable of predicting whether the first criterion for the jumping ability was performed correctly. In addition, it is possible to identify the progress compared to the work of Bisi et al., 2017 and Suzuki et al., 2021.
In the works of Suzuki et al., 2021, the diagnosis of the movement is made in order to visually show the evaluator where there was possibly a failure in the execution of the movement, in this paper, an automatic evaluation approach was presented from images that represent the first criterion, automatically providing the final score for the criterion, however, it is necessary to provide images of the right moments that represent the first criterion, which does not differ from the work of Suzuki et al., 2021 regarding this difficulty, since in their work, it is also necessary for the evaluator to actively identify the points in the video that represent the criteria.
Regarding the work by Bisi et al., 2017, this paper presents no need for equipment to evaluate the first criterion of the jumping skill. The agreement between professional assessments and the automatic assessment that achieved in their work was 87% on average, which is very close to the results of the proposal of this paper. However, it is important to note that the comparison is difficult, because in the case of Bisi et al., 2017, complete movements are evaluated.
Conclusions
Measuring motor development in children is extremely important, as it is fundamental for both the child’s physical and social issues. A child with deficits in motor development will certainly be more likely to present physical and cognitive problems during their maturation period.
The work presented an approach to solving the automatic evaluation problem of the first criterion of the TGMD-3 jumping skill. The children’s skeletons were extracted with PoseNet and a model was presented in the selection of features to represent the first criterion, that is, the preparatory movement for the jump skill. With the proposed modeling, it was possible to induce models capable of predicting whether the movement was performed correctly.
Machine-learning models were generated using the K-nearest neighbors, Random Forest, and One-class SVM algorithms. The model generated by the One-class SVM obtained an average accuracy of 77%, in this model the anomaly detection technique was used. The models generated by K-nearest neighbors and Random Forest had an average accuracy of 84%.
The work stands out, compared to other approaches, in the simplification of the processes involved and the direct inference of the criterion score. In the proposed approach, the use of sensors attached to children and specific equipment is not necessary.
As future work, it would be interesting to carry out the same feature modeling process for the remaining criteria of the jumping skill, providing an overview of a complete skill, also it would be interesting the implement of automatic assessment for the other skills of the TGMD-3 test.
Some major challenges can be found, mainly, in skills that involve object detection, such as the balls used in the manipulation skills, but there are expectations for new studies in the area addressing the automatic assessment of motor development by the TGMD-3 test.
In addition, it is possible to point out, as an important step for future work, the automatic recognition of key points in the children’s videos, facilitating the identification of moments in the video in which the criteria are evaluated.
Author contributions
E.L. Pilati Filho, J.D. Brancher, and R.M.O. Spinosa participated in: Conceptualization, Original Draft Preparation, Writing – Review and Editing. R.M.O. Spinosa and E.L. Pilati Filho participated in: Data Curation, Investigation. J.B. Brancher participated in: Project Administration, Supervision. E.L. Pilati Filho participated in: Formal Analysis, Methodology, Software Programming, Validation and Visualization.
Conflicts of interest
The authors declare no conflict of interest.
Acknowledgments
The authors would like to thank the Computer Science Department of State University of Londrina (UEL) where the research was developed.
References
Abadi, M., Agarwal, A., Barham, P., Brevdo, E., Chen, Z., Citro, C., Corrado, G., Davis, A., Dean, J., Devin, M., Ghemawat, S., Goodfellow, I., Harp, A., Irving, G., Isard, M., Jia, Y., Jozefowicz, R., Kaiser, L., Kudlur, M., ... Zheng, X. (2015). TensorFlow: Large-Scale Machine Learning on Heterogeneous Systems. Arxiv.
Bisi, M., Pacini Panebianco, G., Polman, R. & Stagni, R. (2017). Objective assessment of movement competence in children using wearable sensors: An instrumented version of the TGMD-2 locomotor subtest. 42-48. https://doi.org/10.1016/j.gaitpost.2017.04.025
Gallahue, D., Ozmun, J., & Goodway, J. (2013).Com-preendendo o desenvolvimento motor-: bebês, crianças, adolescentes e adultos. AMGH Editora.
Gonzalez, S., Alvarez, V. & Nelson, E. (2019). Do Gross and Fine Motor Skills Differentially Contribute to Language Outcomes? A Systematic Review. Frontiers In Psychology, 10, 1-16. https://doi.org/10.3389/fpsyg.2019.02670
Estimativa de pose humana em tempo real no navegador com TensorFlow.js. (2018). TensorFlow.
Henderson, S., Sugden, D. & Barnett, A. (2007). Movement assessment battery for children. (2nd. ed.). APA Psyc.. https://doi.org/10.1037/t55281-000
Clark, Jane E. (2005). From the Beginning: A Developmental Perspective on Movement and Mobility. 37-45. https://doi.org/10.1080/00336297.2005.10491841
Jo, B. & Kim, S. (2022). Comparative analysis of openpose, posenet, and movenet models for pose estimation in mobile devices. 39(14), 119-124. https://doi.org/10.18280/ts.390111
Kiphard, E. & Schilling, V. (1974). Köper Koordinationstest für kinder KTK. Weinheim: Beltz Test.
Lin, T. -Y., Maire, M., Belongie, S., Hays, J., Perona, P., Ramanan, D., Dollár, P., & Zitnick, L. (2014). Microsoft COCO: Common Objects in Context. InD. Fleet, T. Pajdla, B. Schiele, & T. Tuytelaars(Eds.). Computer Vision ECCV 2014 (pp. 740-755, Lecture Notes in Computer Science, Vol. 8693). Springer Cham. https://doi.org/10.1007/978-3-319-10602-1_48
Manoel, E. & Connolly, K. (1995). Variability and the development of skilled actions. 129-147. https://doi.org/10.1016/0167-8760(94)00078-S
Marques, I., Santos, C. & Medina-Papst, J. (2017). Teste de desenvolvimento motor para educação física escolar.
Pedregosa, F., Varoquaux, G., Gramfort, A., Michel, V., Thirion, B., Grisel, O., Blondel, M., Prettenhofer, P., Weiss, R., Dubourg, V., Vanderplas, J., Passos, A., Cournapeau, D., Brucher, M., Perrot, M. & Duchesnay, E. (2011). Scikit-learn: Machine Learning in Python. 2825-2830.
Rosa Neto, F. (2002). Manual de avaliação motora. Artmed.
Spinosa, Rodrigo Martins de Oliveira (2019). Demonstração digital de habilidades motoras aplicada à instrumentos de valiação do desenvolvimento motor [Doctoral dissertation, Universidade Estadual de Londrina]. Biblioteca Digital..
Suzuki, S., Amemiya, Y. & Sato, M. (2019). Enhancement of gross-motor action recognition for children by cnn with openpose. In Institute of Electrical and Electronics Engineers, IECON 2019 [Conference]. 45th Annual Conference of the IEEE Industrial Electronics Society, Lisbon, Portugal. https://doi.org/10.1109/IECON.2019.8927828
Suzuki, S., Amemiya, Y. & Sato, M. (2020). Enhancement of child gross-motor action recognition by motional time-series images conversion. In Institute of Electrical and Electronics Engineers, IEEE/SICE International Symposium on System Integration (SII), [Symposium]. Honolulu, HI, USA.. https://doi.org/10.1109/SII46433.2020.9025833
Suzuki, S., Amemiya, Y. & Sato, M. (2021). Skeletonbased visualization of poor body movements in a child's gross-motor assessment using convolutional auto-encoder. In Institute of Electrical and Electronics Engineers, IEEE International Conference on Mechatronics (ICM) [Conference]. Kashiwa, Japan. https://doi.org/10.1109/ICM46511.2021.9385618
Ulrich, D. (2000). The test of gross motor development. PRO-ED.
Ulrich, D. (2017). Introduction to the Special Section: Evaluation of the Psychometric Properties of the TGMD-3. 1-4. https://doi.org/10.1123/jmld.2017-0020
Valentini, N., Zanella, L. & Webster, E. (2017). Test of Gross Motor Development—Third Edition: Establishing Content and Construct Validity for Brazilian Children. 15-28. https://doi.org/10.1123/jmld.2016-0002