
Evaluation of Intergranular Corrosion in 7050-T7451 Aluminum Structures Influenced by Temperature and Contact with Cutting Fluid
Valentim, M. M; Santos, A. L.; Schieri, V. J.; Gonçalves, J. F. S.
DOI 10.5433/1679-0375.2023.v44.47981
Citation Semin., Ciênc. Exatas Tecnol. 2023, v. 44: 47981
Abstract:
This research presents a practical approach to the development of the intergranular corrosion in 7050 - T7451 aluminum alloy used in the construction of manifold components of an aircraft structure. At first, it is presented what type of corrosion this is and how it develops in the crystalline structure, noting which variables contribute to the aggravation of this problem and their impacts on aviation, since this is the beginning of a number of structural defects included fatigue, which stands out even more because of the circumstances that are presented. The performance of the tests in laboratory seeks to evaluate the reactions of the material when exposed to cutting fluid and thermal variations for a long period; the development of corrosion in the microstructure has been simulated, and with this the loss of mechanical resistance of the samples could be evaluated. The results obtained indicate that the cutting fluid even slowly, showed effects in the propagation of corrosion in the alloy of aluminum studied and reduced your mechanical strength.
Keywords: 7050-T7451 aluminum alloy, intergranular corrosion, cutting fluid, mechanical resistance
Introduction
Corrosion is considered the degradation of a metal or metal alloy in contact with the environment or due to chemical and/or mechanical conditions, seeking to reach a steady state (ie, hydroxides, oxides or sulfides). It can be classified in three ways: electrolytic, electrochemical and chemical corrosion, with electrochemistry being responsible for most of the processes that occur (Gentil, 2007). The phenomenon of corrosion is due to the increase in the speed of the attack of the metal due to the relative movement between the metallic surface and the corrosive fluid. For pure metals and their alloys, they exhibit a reaction that is a consequence of the natural or spontaneous tendency that these materials have to return to the most thermodynamically stable form of minerals (Asm, 2003).
Existing corrosion problems are important due to two main factors. Economic power is the first aspect, due to its high cost. In Brazil, according to data from 2006, it showed an annual cost due to corrosion of approximately 40 billion reais (Costa et al., 2014), remaining active until today. These huge financial losses are incurred by the loss of resistance, which also compromises safety (Aslam & Verma, 2023). The second factor mentioned is the preservation of mineral reserves, since additional production is relevant due to the replacement of what is deteriorated (Dutra, 2006).
Therefore, we can infer that resistance is a scourge of Modern Society, since the evolutionary losses resulting from it, not counting as human nature, are of the order of many hundreds of billions of euros (Martins & Martins, 2012). The American aviation industry is worth $2.2 billion, which includes design and manufacturing costs ( $0.2 billion), membership maintenance ( $1.7 billion), and downtime due to resistance (US $ 0.3 billion) (Koch et al., 2002).
Codaro, 2006 reported that an increase in temperature (between 5º and 50 ºC) proportionally increases the corrosion potential of aluminum alloys 7050-T7. Nevertheless, problems involving the intergranular corrosion of aluminum alloy 7050-T7451 were studied by Sichieri, 2015 through its exposure to oil-based cutting fluid from Jatropha curcas L., a plant species found in almost all intertropical regions of the world (Drumond et al., 2008), which acted as a corrosive agent in the grain boundary region and making the material more susceptible to chemical attack.
Therefore, the objective of this research work was to evaluate the influence of temperature and parameters of the cutting fluid on the development of the intergranular texture and changes in the surface resistance of an aluminum alloy 7050-T7451 used in multiple components of aeronautical structures; additionally, the mechanical properties were evaluated through the tensile test.
Materials and methods
The analysed material, aluminum 7050-T7451, is typically used in the manufacture of aeronautical structures. The research addressed the impact of cutting fluid on the development of intergranular corrosion and consequent reduction in the mechanical strength of the material.
The development is described step by step in the order of carrying out the procedure.
The flowchart illustrated in Figure 1, indicates the preparation phases for carrying out the hardness test and microscopic analysis of the samples.

The specimen used was obtained by milling machining operation, manufactured at high cutting speeds.
Soluble cutting fluid was used to cool the machining process.
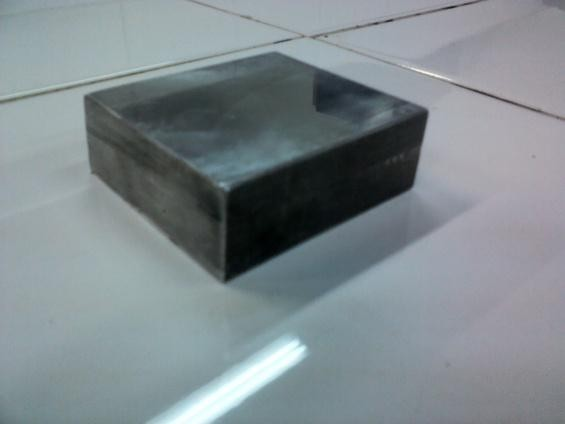
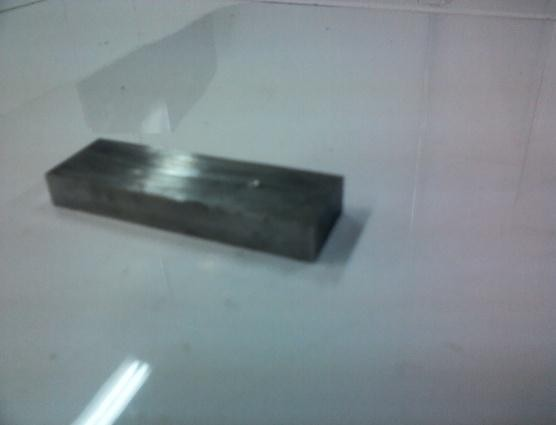
The first stage consisted of preparing the materials to be exposed to the analysis variations. Figure 2(a) shows the raw block and Figure 2(b) shows identical rectangular cut pieces.
The first rectangular samples were made to perform metallography and hardness testing. The rectangular samples in Figure 2(b) were immersed for 10 weeks in a vegetable-based soluble fluid (jatropha oil with a concentration of 8 % oil), within this period, every 5 days, they were removed to dry at room temperature for 48 hours .
| (a) | (b) |
 |  |
Hardness test and microscopic analysis
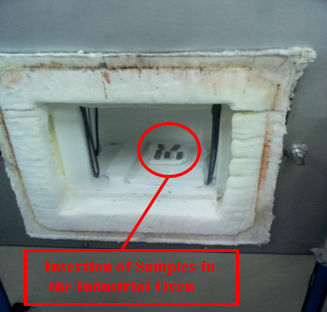
At the end of the time of exposure to the cutting fluid, the first three samples were placed in an industrial oven with two more samples without any exposure, with the objective of suffering temperature variations to analyse the influence on the development of corrosion and, consequently, its alteration in the surface resistance. The samples remained in the oven for 10 minutes at a temperature of 100 °C, then were removed from the oven and allowed to cool at room temperature for 15 minutes. This cycle was repeated 10 times.
An industrial oven with temperature control, from the manufacturer Sanchis, model N1100, shown in Figure 3 was used.
 |
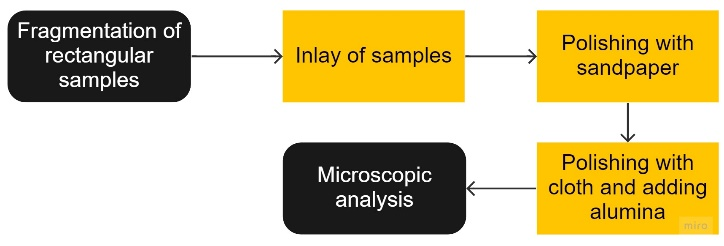
After undergoing thermal variation, the next step was to prepare the samples to be polished and analysed under the microscope, the flowchart in Figure 4 summarizes this procedure.
Two microscopes were used, Dino-Lite model AM-413TL and Inverted Metallographic Microscope Opton TNM-07T-PL, with magnification from 80 to 400 times to obtain the images in Figures 6, and 12 to 18.
Fragments were removed from each sample and embedded with Bakelite, the machine used was a Struers Panamera. Then, the samples were polished with sandpaper of 400, 600, 800, 1200 and 2000 square centimeters and finished with a polishing cloth adding alumina solution nº 2. Figure 5 shows how the rectangular samples were ready for analysis, after cut into fragments, embedded and polished.

After finishing the preparation, the samples were submitted to analysis without the addition of hydrofluoric acid, which is indicated for metallography in aluminum alloys, so that it would not hinder the identification of corrosive evolution.
Comparing the differences present with and without the addition of hydrofluoric acid in each sample, one can see the difference in visualization.
The two situations are shown below. In Figure 6(a) with the addition of hydrofluoric acid, which increased intergranular resistance, which is why it was not used, and in Figure 6(b) without the application of hydrofluoric acid.
| (a) | (b) |
 |  |
The location of the image analysis points was defined in two sectors of the sample, which are shown in Figure 7. The two points were selected to be cut and separated from the rectangular samples before embedding. The two sectors were chosen to compare the evolution of intergranular corrosion. It is evaluated in Figure 7(a) how the distribution of corrosion occurs by observing the surface of the wall and in Figure 7(b) how the corrosion proceeds to the interior of the tested body by observing the front contour. Both Figures 7(a) and 7(b) allow the observation of corrosive triggering so that the distribution of intergranular corrosion can be compared at two different points of the same sample.
| (a) | (b) |
 |  |
The machine used for hardness testing is a Pantec RBS - M hardness tester, red B scale, load greater than 100, steel indenter 1.5875 mm, and range of use from 20 to 100 HBR, provided by the materials testing laboratory of UTFPR – Cornélio Procópio, Paraná, Brazil.
The hardness test was carried out in order to evaluate the behavior of the surface resistance of the parts machined with and without cutting fluid. Hardness values were evaluated at three different points on the surface of each sample, as shown in Figure 8.
The three measurement points on the same specimen serve to obtain a reliable hardness average:
the three samples subjected to the cutting fluid and thermal variation are those of sample Group nº 3;
the two specimens that suffered only thermal variation are those from sample Group nº 2;
the specimen without any influence (temperature or cutting fluid) is from Group nº 1.
Traction test
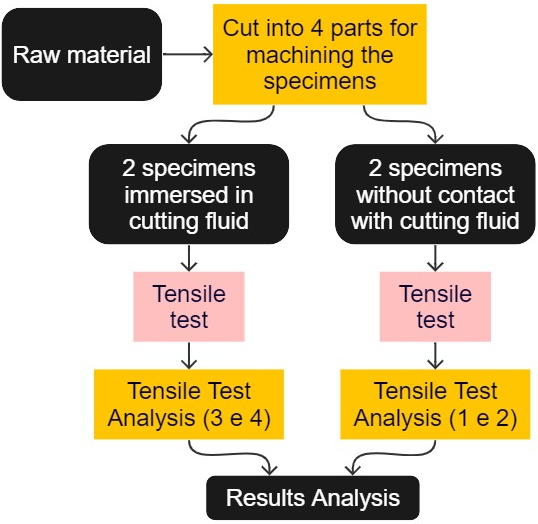
The flowchart in Figure 9 indicates the steps for carrying out the tensile test.
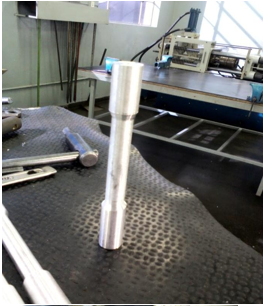
The specimens were machined on a lathe, model TORMAX 20 – ROMI, provided by SENAI – Londrina, Paraná, Brazil, according to ASTM E8M standard for tensile tests. A finished specimen after machining can be seen in Figure 10.
Four specimens were machined, two of which were immersed in a bath with cutting fluid and the other two kept without contact with the fluid, so it was possible to make a comparative analysis between the mechanical strength of these specimens.
The specimens were bathed in cutting fluid for two weeks at room temperature, as shown in Figure 11. The samples were left out of the bath for one hour a day, and exposed to room air so that they could dry and react with oxygen.

The immersion time of the specimens for the tensile test was shorter in relation to the rectangular samples due to the difficulty of obtaining this aluminum alloy in sufficient quantity and time for the research.
The equipment used was a TIME GROUP tensile testing machine, model WDW-100E, with a capacity of 10,000 kgf of traction and compression, provided by the UTFPR-Cornélio Procópio materials laboratory.
Through the tensile test, it was possible to obtain the mechanical properties, such as resistance, elasticity, rupture, elongation and friction limits of this 7050 aluminum alloy, before and after immersion in cutting fluid.
Results and discussion
Microscopic analysis of the sample without corrosive exposure
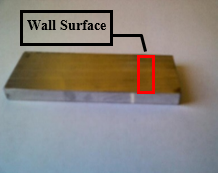
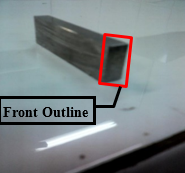
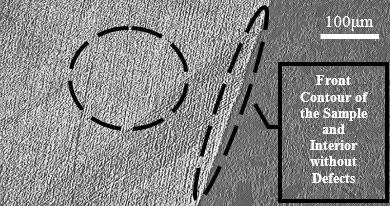
Figure 12(a) shows a front contour view of the sample and in Figure 12(b) the wall surface. This material has not suffered any exposure to cutting fluid or thermal variation. It can be considered without defects generated by intergranular corrosion, and this image is taken as a form of comparative analysis with the next samples that will be presented, which suffered corrosive exposure.
| (a) | (b) |
 |  |
Microscopic analysis of the sample submitted to thermal variations
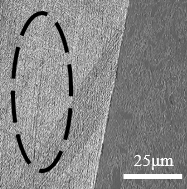
Figure 13 presents the samples that suffered only temperature variations, showing the view of the front contour of two different samples. These images show a small difference when compared with the previous images in Figure 12, some bright spots can already be identified at the ends, but with little invasion of corrosion into the interior of the sample.
Microscopic analysis of samples exposed to fluid and thermal variations
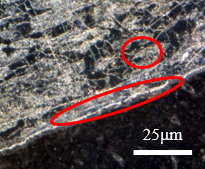
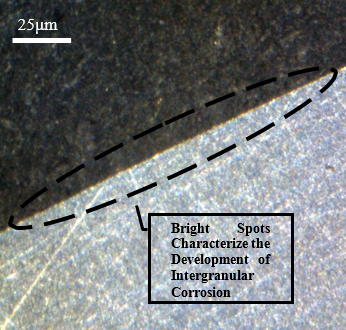
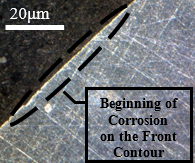
Figure 14 shows the frontal outline of the samples subjected to the cutting fluid, through which the occurrence of corrosion towards the interior of the material is visualized under identical conditions of immersion in the fluid and temperature variations. In images a, b, c, and d shown in Figure 14, damage caused by intergranular corrosion is observed. In the demarcated regions the development of corrosion is evident, leading to degradation.
| (a) | (b) |
 |  |
| (c) | (d) |
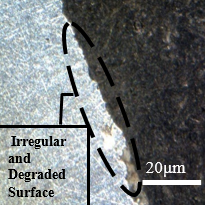 |  |
Degradation is identified around the material. This is due to the material loss factor in the circled regions, a brighter coloration and an irregular surface can be seen, in addition to many degraded points. This alteration is due to the advance of the corrosion initiated between the grains of the structure, this advance led to a loss of connection with the matrix, which, during polishing, suffered a slight fragmentation, that is, the contour of the grain suffered a decrease in the bond strength. between one grain and another, leading to a segregation of those circumscribed by corrosion. Analysing the Figures 12 and 13, these characteristics cannot be identified since the bonding of the material is strongly established in all regions of the structure on a larger scale than the degraded samples.
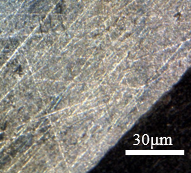
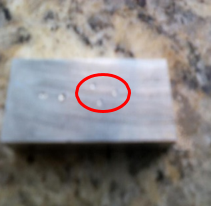
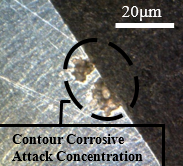
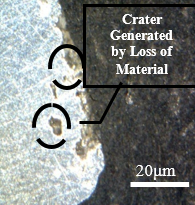
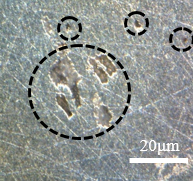
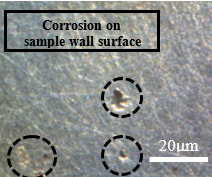
Figure 15 shows the same samples as Figure 14, but with different points of microscopic approximation, now the surface regions of the wall are visualized, as circled in the images below. In the contour of the circled crater, a bright coloration can be noticed, this difference in tone can mean the corrosive advance that is given by the weakening of the material grains, leading to the highlighted crater.
| (a) | (b) |
 |  |
| (c) | (d) |
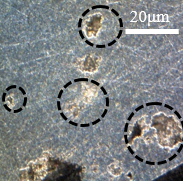 | 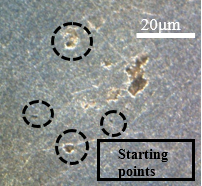 |
The deterioration procedure that occurs at different scales in Figure 15 supports saying that this type of corrosion occurs with good distribution over the surface of the material. Figures 15(b) and 15(d) show the beginning of corrosive development, while Figures 15(a) and 15(b) show a more advanced stage of deterioration. There was a greater loss of material, as this figure is an image focused on the sample wall, the observation of the surface is different from Figure 14, which shows the frontal region of the sample, focused on the contour.
Through the analysed samples, the most striking observation is the generalized superficial embrittlement, it is clear that the corrosion managed to develop inside the material, because, even with the polishing removing material from the surface, many corrosion points were observed distributed in a new layer superficial that arose.
In contrast to Bork et al., 2014, Jatropha oil interferes with the elements involved in the formation of intergranular corrosion when exposed for a long time and not only during the machining process of aluminum alloy 7050-T7451.
Final analysis of samples observed by microscope
Figures 16 to 18 clarify the main differences between each type of sample. Comparing Figure 16, which shows a material without any exposure, cutting fluid, or thermal variations, with Figures 17 and 18, which were subjected to these two factors.


The material that was not influenced served as a means of comparison with those that were influenced by the factors analysed in this research, such as cutting fluids and thermal variations.
Exposure to the cutting fluid combined with temperature variations accelerated the intergranular corrosion process. In Figure 17 it is possible to visualize a detachment of the grains, separating from the main matrix, motivated by the degradation of the binder materials such as Zinc, Magnesium, and Copper. These are the causes of structural weakening, as they are more fragile than the aluminum matrix, these binding materials are responsible for the strong connection between grains, when this link weakens generates a reduction in local resistance, insofar as these interstitial defects propagate the structure is compromised and opens up to countless other problems, one of which is fatigue, which is intensified.
The microstructural elasticity is compromised because the capacity of a grain to return to its place of origin is no longer the same, the sliding is accentuated until the final development, generating a structural collapse, that is, the rupture of the material.
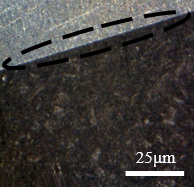
With the magnification of 400 times, the initial points of circumscription and the grains being highlighted were visualized in the indicated places. The dark regions are the areas where there was a superficial decline generated by the loss of material, forming a crater, this variation in depth causes this difference in hue.
In Figure 18, there is a more generalized view, it is possible to visualize clearly the crater generated by the detachment of the grains and to visualize how the sample was compromised macroscopically. Many corrosion points are found in the initial and more advanced regime, and one can see the difference between cutting fluid and the thermal variations caused by this aluminum alloy.
Table 1 summarizes all analyses carried out by microscope, classifying them into levels of deterioration caused by intergranular corrosion, and assigning weights to quantify the corrosion suffered by the sample:
Little or no sign of change: 1;
Low incidence: 2;
High incidence: 3.
.
| Sample type | Corrosion |
| incidence | |
| No exposure of any kind | 1 |
| Exposed to thermal variation | 2 |
| Exposed to fluid and thermal variation | 3 |
Hardness analysis
Table 2 shows the difference in surface hardness between the samples that were exposed to immersion in cutting fluid and temperature variations. It shows the values measured through the hardness test for each sample group, divided into three.
Group nº 1: Samples that were in a cutting fluid bath and then underwent temperature variations;
Group nº 2: Samples that suffered temperature variations;
Group nº 3: Sample without any changes.
| Sample | Measurement | ||||
| 1st | 2nd | 3rd | |||
| Group nº 1 | 1st | 76.0 | 76.7 | 73.9 | |
| 2nd | 73.7 | 77.0 | 78.3 | ||
| 3rd | 75.3 | 80.0 | 76.0 | ||
| Group nº 2 | 1st | 75.5 | 75.7 | 79.3 | |
| 2nd | 76.2 | 78.0 | 80.7 | ||
| Group nº 3 | 1st | 77.0 | 76.5 | 77.8 | |
After gathering the surface hardness of each set, a simple arithmetic average was made for each sample group and an average hardness resulting from each situation was arrived at, see Table 3.
| Group | Average rockwell |
| hardness (HRB) | |
| nº 1 | 76.32 |
| nº 2 | 77.58 |
| nº 3 | 77.10 |
The three groups of samples showed different strengths, samples from Groups nº 2 and nº 3 had a higher surface hardness value, demonstrating greater surface integrity.
Group nº 1 had a lower average hardness due to the reduction in the bonding force in the grains that make up the structure close to the surface, this superficial weakening of the material may have been caused by the corrosion analysed in this research.
Intergranular corrosion is always the threshold of a corrosive process. It is the initial stage of a process that develops for a series of other critical situations for the material, the hardness test shows a decrease in resistance by 1.62 %, compared to the average of Group nº 2, which suffered the same thermal variation. In the long term, the damage intensifies more and more in the crystalline grains, reducing the nominal mechanical resistance of the material, that is, the initial structural bond strength of the material.
Group nº 2 had a higher value than Group nº 3 motivated by the slight surface hardening that the thermal variation caused, increasing the residual stresses in these places, that is, in the vicinity of the surface there was a slight tensioning between the grains of the aluminum alloy. The hardness value of Group nº 3 was lower due to the disarrangement triggered by intergranular corrosion, the bonds between the grains were compromised, reducing their resistance.
To conclude and exemplify the data obtained with the hardness test, Table 4 shows the final conclusions.
| Average | Hardness behavior |
|---|---|
| Group nº 1 | no variations in surface |
| resistance pattern | |
| Group nº 2 | increased surface |
| mechanical resistance | |
| Group nº 3 | reduction in surface |
| mechanical resistance |
Tensile test analysis
The tensile test was carried out to compare the mechanical resistance of the specimens that were bathed in the cutting fluid with the specimens that did not undergo any exposure that would accelerate intergranular corrosion. In this way, it is possible to quantify the influence of the fluid in this aluminum alloy. The results are presented in Table 5.
| (kN) | (%) | ||||
| Test | Resistance | Yield | Elonga- | Narrow- | |
| limit | limit | tion | ing | ||
| 1 | 55.65 | 45.2 | 6.3 | 6.8 | |
| 2 | 64.75 | 56.8 | 8.6 | 13.2 | |
| 3 | 63.71 | 54.6 | 9.6 | 14.4 | |
| 4 | 63.62 | 54.4 | 7.6 | 9.6 | |
Tests 1 and 2 in Table 5 are for specimens that were not immersed in cutting fluid. Test 1 presented values far from Test 2 because it was the first traction test performed by the machine, which, should have its first test discarded due to self-adjustment, this first test served only for self-calibration of the machine, and for this reason it was disregarded for calculating the averages in Table 6.
Tests 3 and 4 were carried out with the bodies immersed in cutting fluid. When the values obtained were analysed, it was possible to perceive a discrepancy with the values of Test 2.
| (kN) | (%) | ||||
| Sample | Resistance | Yield | Elonga- | Narrow- | |
| limit | limit | tion | ing | ||
| without | |||||
| cutting | 64.75 | 56.80 | 8.80 | 13.20 | |
| fluid | |||||
| with | |||||
| cutting | 63.66 | 54.51 | 8.6 | 12.10 | |
| fluid | |||||
In Table 6, only Test 2 is separated to be compared with the average of the tests in which the test specimens were exposed to the fluid (which is Tests 3 and 4). When comparing the types of samples presented in Table 6 it was observed that the specimens that remained in the cutting fluid showed a decrease in their resistance, which was small due to their period of permanence in the immersion, but which was enough to raise indications about the theory presented during the study.
The resistance limit decreased by 1.68 %, which may be due to the presence of cutting fluid, a significant value when considering the time of only two weeks that the samples remained in the cutting fluid.
The elastic limit decreased by an average of 4 %, which may have been motivated by the weakening of the crystalline bonds generated by corrosion, the grains may have weakened their bonds and were unable to return to their initial position, impairing their restructuring. According to Zhu et al., 2021, this intergranular stress distribution between adjacent grains can greatly affect the mechanical properties. Table 7 makes a summary comparing the final results of each tensile test.
| Average | Result |
|---|---|
| Test 1 | Discarded |
| Test 2 | Standard mechanical resistance |
| Test 3 | Loss of mechanical strength |
| Test 4 | Loss of mechanical strength |
The values of Test 2 are taken as a reference because the specimen was not exposed to any situation to accelerate the loss of resistance, unlike the specimens of Tests 3 and 4 that were bathed in the cutting fluid. Considering that the four test specimens were machined from the same aluminum billet, that is, without any external influence, they would all give the same mechanical strength values.
Conclusion
Therefore, corrosive effects were found in patent specimens in contact with cutting fluid, which through the analyses made it possible to raise evidence that the cutting fluid and the applied thermal variations can contribute to the interference of corrosive processes in aluminum alloys. We also point out the large number of variations that surround the study, and the need to continue the search for the development, identification and consequences of intergranular corrosion of aluminum alloy.
Author contributions
M.M. Valentim participated in the: Conceptualization, Data Curation, Formal Analysis, Investigation, Methodology, Project Managements, Resources, Programs, Supervision, Validation, Visualization, Writing - Original draft, Writing – Revision and editing. A.L. dos Santos participated in the: Conceptualization, Data Curation, Formal Analysis, Investigation, Methodology, Project Managements, Resources, Programs, Supervision, Validation, Visualization, Writing - Original draft. V.J. Schieri participated in the: Conceptualization, Methodology. J.F.S. Gonçalves participated in the: Project Managements, Supervision, Validation.
Conflicts of interest
The authors declare no conflict of interest.
Acknowledgments
The authors would like to express their gratitude for the support in preparing this article.
References
Aslam, J., & Verma, C.(2023). Fiber Materials: Design, Fabrication and Applications. De Gruyter. https://doi.org/10.1515/9783110992892-204
Asm International (2003). Corrosion: Fundamentals, Testing and Protection Metals (Handbook Series, Vol. 13A). ASM Internacional.
Bork, C. A. S., Gonçalves, J. F. S., Gomes, J. O. & Gheller, J. (2014). Performance of the Jatropha Vegetable-Base Soluble Cutting Oil as a Renewable Source in the Aluminum Alloy 7050-T7451 Milling. 7(3), 210-221. https://doi.org/10.1016/j.cirpj.2014.04.004
Codaro, E. (2006).Estudo da Corrosão em Ligas deAlumínio Utilizadas na Indústria Aeronáutica [Tese de Livre-Docência, Universidade Estadual Paulista]. Repositório Digital Unesp. https://repositorio.unesp.br/handle/11449/116075
Costa, R. C., Dacoreggio, M. V., Kejelin, N., & Comeli, F. W.(2014). Evaluation of Resistance to Corrosion of Metallic Coatings Deposited by Thermal Spraying by Arc: An Application in Heat Exchangers. Soldagem & Inspeção, 19(19), 292–301.
Dutra, A. N. (2006). Proteção Catódica - Técnica de Combate a Corrosão (4thed.). Interciência.
Martins, J. I., & Martins, F. P (2012). A Corrosão: A Outra Perspectiva de Abordagem. Corrosão e Proteção de Materiais, 31(3/4), 60–64.
Koch, G. H., Brongers, M. P. H., & Thompson, N. G.(2002). Corrosion Costs and Preventive Strategies in the United States. NACE International, (FHWA-RD-01-156), 1–12. http://impact.nace.org/documents/ccsupp.pdf
Sichieri, V. J. (2015). Avaliação da Corrosão Intergranular da Liga de Alumínio 7050-T7451 Influenciada Pelo Fluido de Corte à Base de Óleo de Pinhão-Manso – Jatropha curcas [Exame de Qualificação do Trabalho de Conclusão de Curso, Universidade Tecnológica Federal do Paraná]. Universidade Tecnológica Federal do Paraná.
Zhu, Q., Cao, L., Liu, Y., Liu, S., & Wu, X. (2021).Intergranular Micro-Deformation Behavior of a Medium Strength 7xxx Aluminum Alloy. Journal of Materials Research and Technology, 12, 471–477. https://doi.org/10.1016/j.jmrt.2021.02.098
Gentil, V. (2007). Corrosão (5thed.). Ltc.
Drumond, M. A., Arruda, F. P., & Anjos, J. B. (2008). Pinhão-manso - Jatropha curcas L.(Embrapa Semi-Árido.Documentos 212).Embrapa Semi-Árido.